Fig. 3.
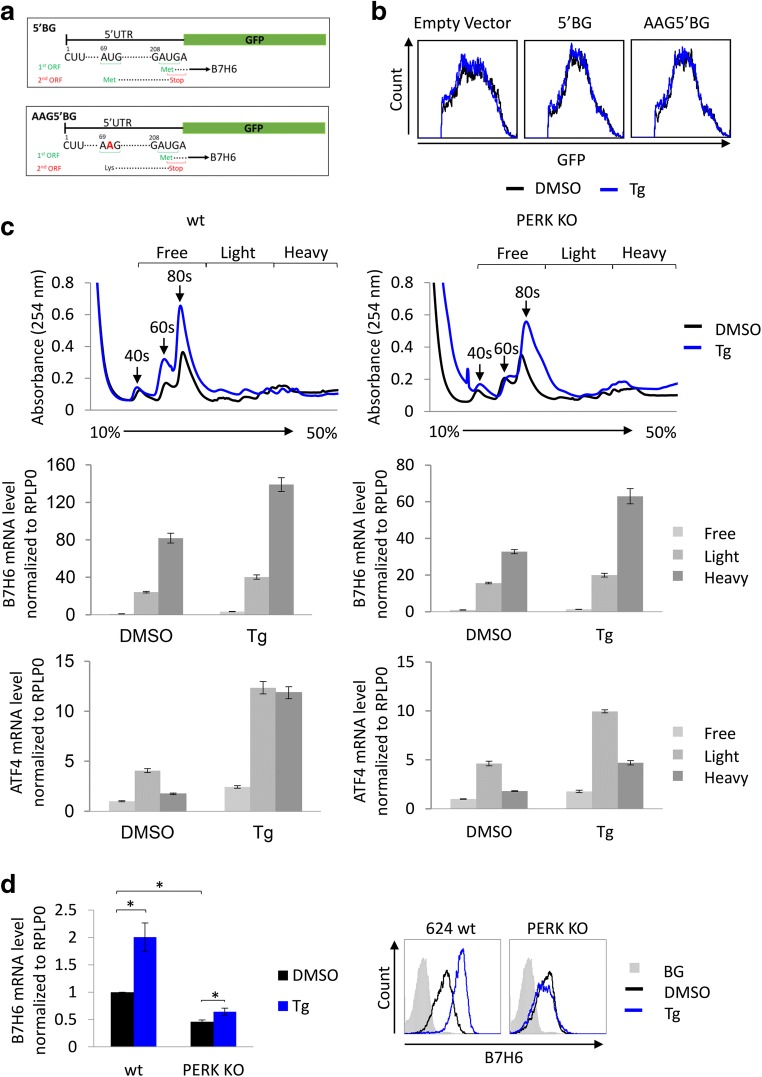
B7H6 induction by ER stress is correlated with its mRNA levels. a Schematic representation of the 5′UTR (untranslated region) of B7H6 (5′BG, upper panel), the lower panel shows the mutated nucleotide from U to A, AAG5′BG. b Measurement of GFP levels by flow cytometry in 624 wt cells stably expressing empty vector, 5′BG or AAG5′BG constructs after treatment with 0.125 μg/ml Tg or mock treated with DMSO for 16 h. c Polysome profiling of B7H6 mRNA in 624 wt or PERK KO cells after treatment with 0.125 μg/ml Tg or mock treated with DMSO for 16 h, presented is the average ± STD of triplicates of the mRNA levels of B7H6 (middle panel) and ATF4 (lower panel) in the different sucrose fractions. d Real-time PCR quantification of B7H6 mRNA in 624 wt or PERK KO cells after treatment with 0.125 μg/ml Tg or mock treated with DMSO for 16 h, represented is the average of relative normalized mRNA levels ± STD of three independent experiments. The right panel represents B7H6 surface levels on the tested cells (BG indicates secondary only background staining, shown is the BG for untreated cells)

