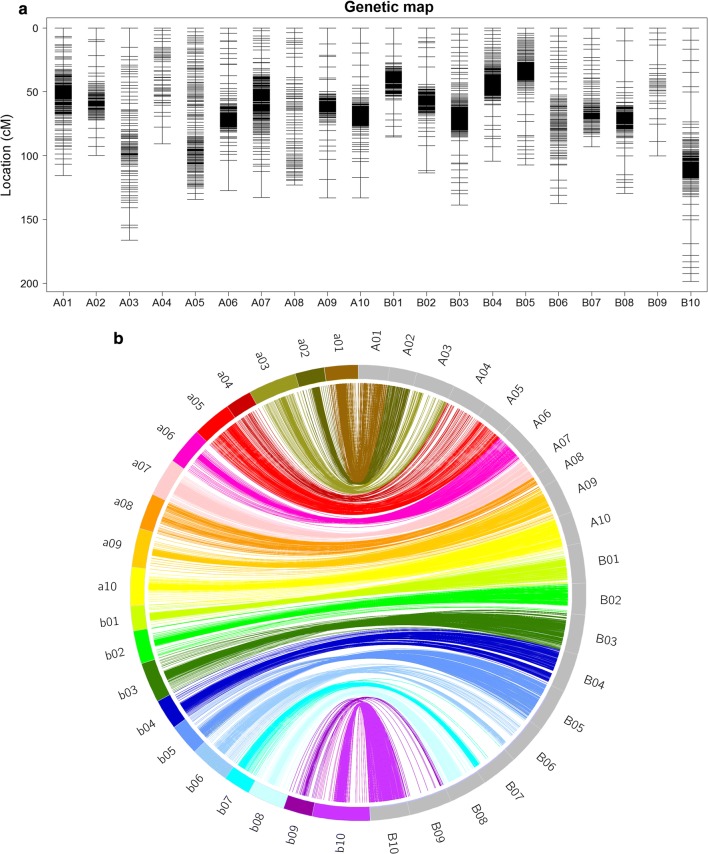
Fig. 2.
Overview of the genetic map constructed using SNP markers. a Distribution of SNP markers on 20 linkage groups. Black bars denote SNP markers. The linkage group numbers are shown on the x-axis. b Collinearity analysis between the genetic map and the physical map. a01–a10 and b01–b10 represent the 20 linkage groups. A01–A10 and B01–B10 indicate physical maps of Arachis duranensis and Arachis ipaensis, respectively

