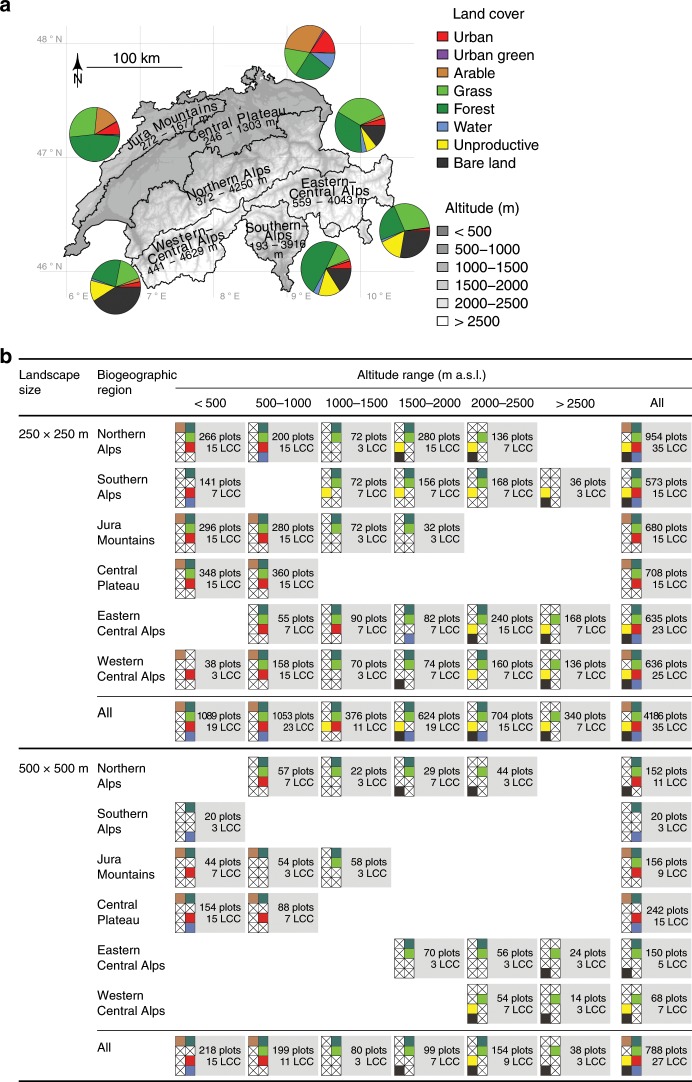
Fig. 1. Study design: study area and selected networks of 250 × 250 m and 500 × 500 m landscapes.
a The study area was divided into blocks defined by biogeographic region (BGR; names in map) and altitude ranges. Pie charts show the fractional cover of the land-cover types in the different BGRs. b Within each block, the largest possible set of land-cover types was chosen that allowed constructing gradients in landscape richness with all possible land-cover combinations realized (see (a) for color legend; crosses indicate land-cover types not used in the respective block). Landscape richness was thus orthogonal to fractional contribution of any land-cover type. Plots: the number of landscape plots; LCC: the number of unique land-cover compositions in the corresponding BGR and altitude ranges.

