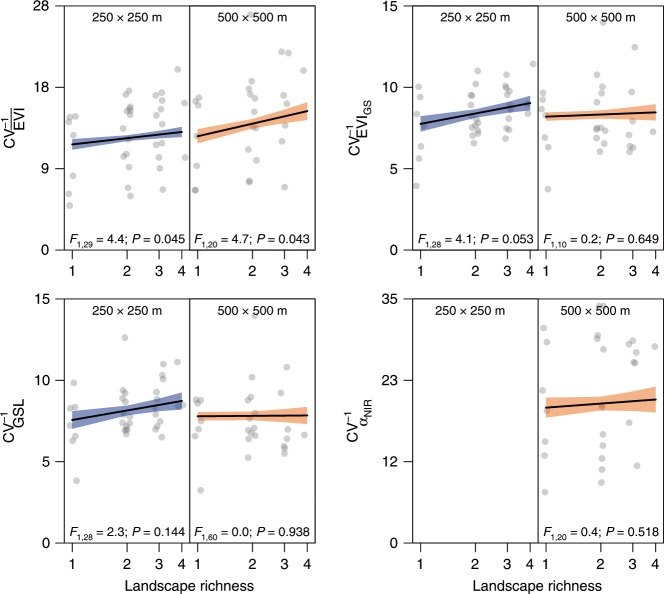
Fig. 3. Effects of landscape richness on the temporal stability of landscape functioning variables.
Stability is expressed as inverse coefficient of variation (CV−1). Productivity: growing-season mean enhanced vegetation index (), growing-season integrated enhanced vegetation index (EVIGS). Phenology: growing-season length (GSL); Albedo: near-infrared range (αNIR, 500 × 500 m landscape plots only); black line and shaded areas: model-predicted mean ± s.e.m.; F: F-ratio with associated degrees of freedom; P: P-value. Symbols indicate averages for each land-cover composition (n = 237 and 77 for 250 × 250 m and 500 × 500 m land-cover composition × block combinations, respectively). Source data are provided as a Source Data file.

