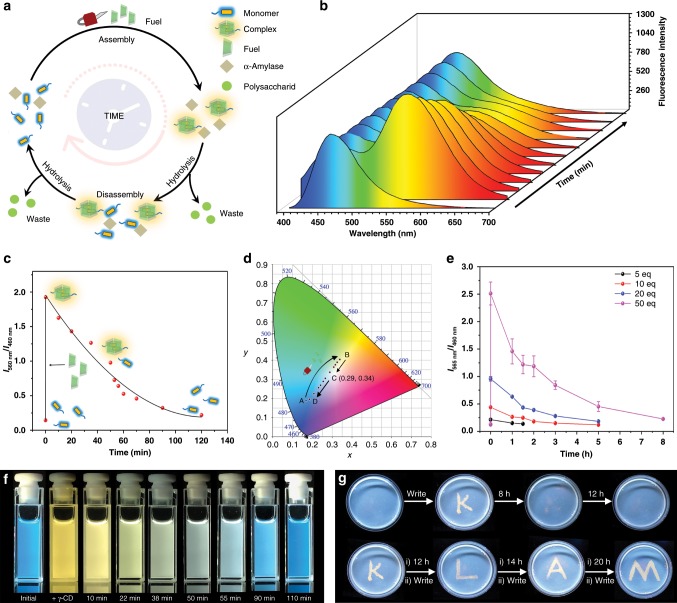
Fig. 5. Controlling the multi-color fluorescent system on a time scale.
a Schematic representation of the transient assembly cycle of compound 1 and γ-CD, resulting in an out-of-equilibrium multicolor fluorescence. b Time-dependent fluorescence spectra showing the change of the fluorescence (from yellow to blue; compound 1 3 μM, α-amylase 1 mg ml−1, phosphate buffer pH = 5.2). c Time-dependent relative fluorescence intensity. The delay rate of the relative fluorescence intensity gradually decreased, suggesting a self-regulated mechanism. d Time-dependent CIE coordinate diagram corresponding to b, showing the trajectory of the out-of-equilibrium emission color change. e The concentration of the chemical fuel regulated by timescale (compound 1 5 μM, γ-CD 5−50 eq, α-amylase 1 mg ml−1, phosphate buffer pH = 5.2). Data are presented as the mean ± s.d. (n = 3). f A series of fluorescence images of the out-of-equilibrium fluorescence. g Writing into a self-erasable fluorescence gel (compound 1 1 mM, α-amylase 1 mg ml−1, phosphate buffer pH = 5.2). (i) Messages stayed for the specific hours. (ii) Chemical fuel input by writing with γ-CD aqueous solution.

