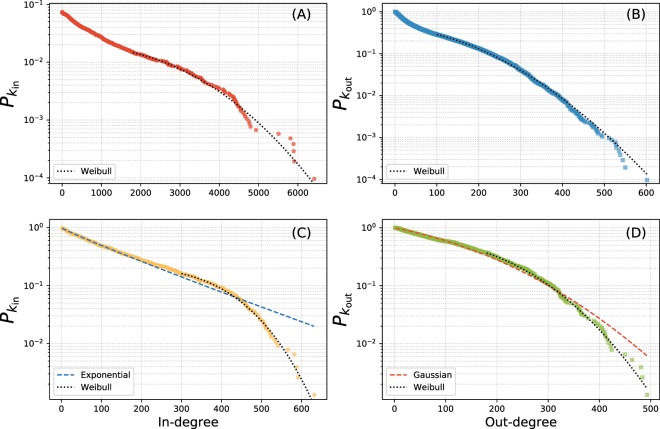
Figure 2.
The in and out-degree distributions for the full network and the strong component. Upper panels (A) and (B): the complementary cumulative degree distributions for the full network Pk for the in-degree in panel (A) and the out-degree panel (B). The tail of each are well fitted by Weibull distributions. Lower panels (C) and (D): the degree distribution for the strong component with the in-degree distribution displayed in panel (C), this receives the best support from an exponential distribution (dashed line), however, fitting to the tail a Weibull (dotted) is best supported. In panel (D) the out-degree distribution is shown, the whole distribution (dashed line) is well fitted by a normal distribution (dashed) and the tail, again, by a Weibull (dotted).

