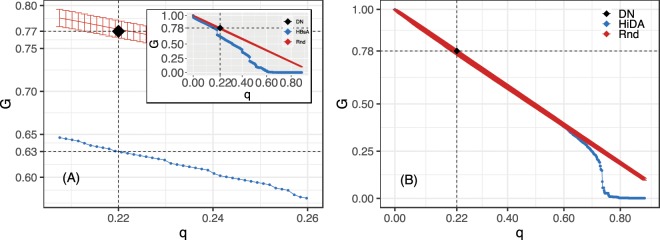
Figure 5.
The figure shows the fragmentation process. In the left panel (A), the inset figure shows the size of the largest strongly connected component as a function of the fraction of nodes removed according to the best topological attack (HBsA - blue curve), the mean and error bars for a 1,000 random attacks (red curve, Rnd), and the real police intervention result (black diamond shape, DN). In this case the network only breaks completely after 60% of removals. The main figure shows a zoom in near the real police intervention which resulted in a 23% decrease of the strongly connected component, while the topological attack resulted in a 37% breakdown (1.6 times more efficient). The right panel (B) shows the same process but now considering the relative size of the largest connected component (regardless of strong and weak components). Note that in this case even the best topological attack (high in-degree adaptive attack, HiDA) in the region that real police intervention took place is as good as random and the network only breaks after almost 80% of disruption.

