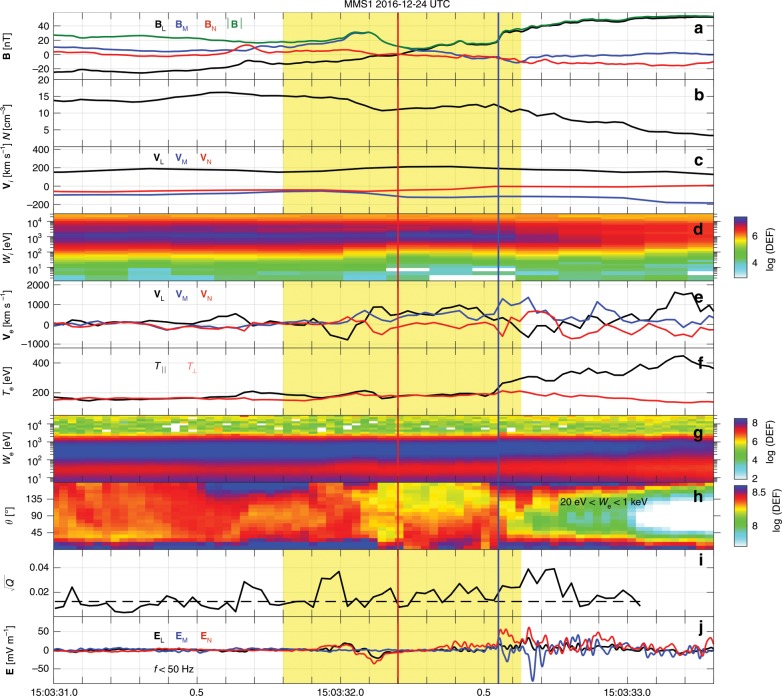
Fig. 1. Magnetopause crossing observed by MMS1.
a B. b Number density . c V. d Ion differential energy flux (color scale, in unit of keV s cm sr keV). e V. f Electron and . g Electron differential energy flux. h Electron pitch-angle distribution between 20 eV and 1 keV. i Agyrotropy measure 27 with a background of 0.012 (black dashed line). j E with frequencies 50 Hz. The vectors are all presented in LMN coordinate system. The red and blue vertical lines represent the neutral line and the magnetospheric separatrix, respectively. The agyrotropy measure with 5 cm is neglected. A detailed overview of the yellow-shaded region is presented in Fig. 3.

