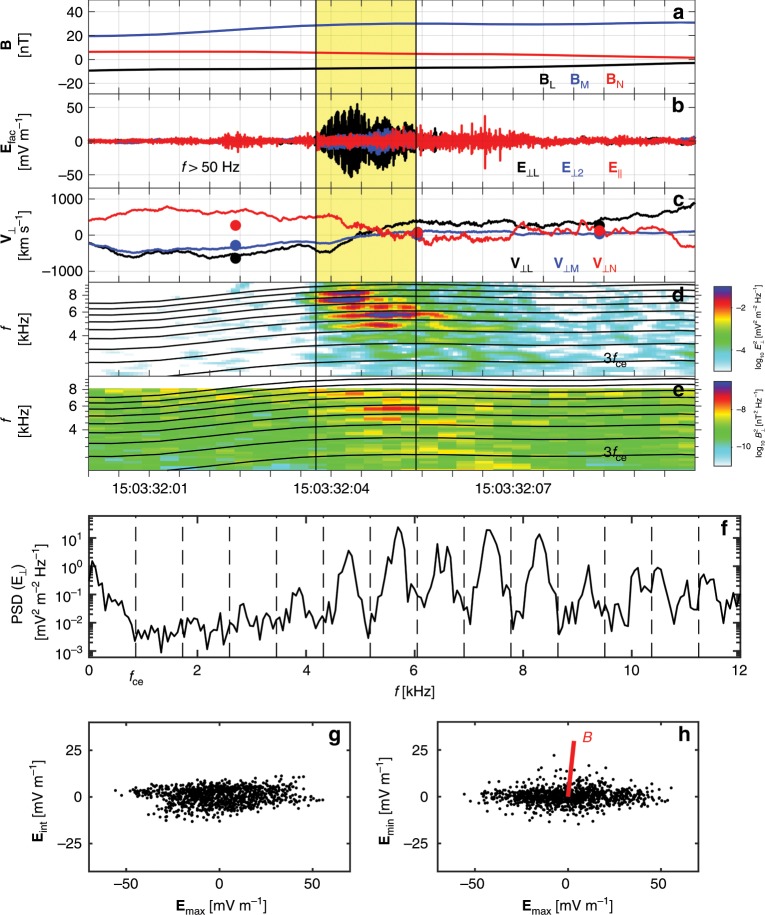
Fig. 4. EBWs observed near EDR.
a B. b Perpendicular and parallel components of the high-frequency E with 50 Hz. (c) EB/B (lines) and 30-ms resolution V (dots). d Power spectrogram of E. e Power spectrogram of B. The electron cyclotron harmonic frequencies are plotted in (d, e). The yellow-shaded region from 15:03:32.037 to 15:03:32.054 UTC highlights the E fluctuations with amplitudes larger than E/, where E is the peak of the fluctuating E, and e is the Euler identity. f Power spectrum of E within the yellow-shaded region. The average and the harmonic frequencies are over-plotted. g, h Hodograms of E versus E, and E versus E. The red line in (h) denotes the B direction. During the EBWs observations, the electron plasma frequency 32.9 kHz is well above the electron cyclotron frequency 860 Hz.

