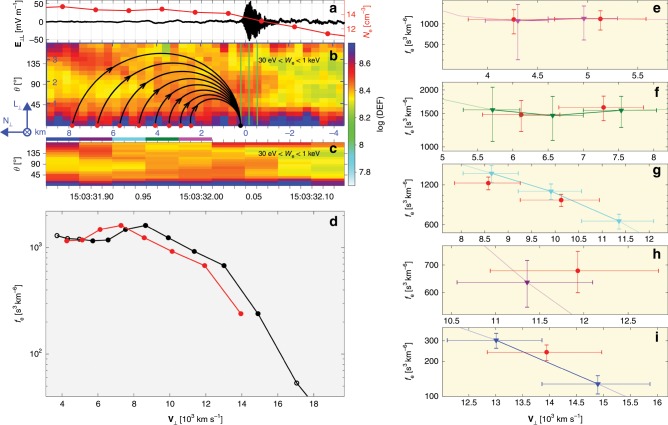
Fig. 5. Electron crescents generated by finite gyroradius effect.
a E with 50 Hz and . b Electron pitch-angle spectrogram using 7.5 ms FPI data and trajectories of 93−631 eV electrons. c Electron pitch-angle spectrogram using 30 ms FPI data. In (d), the black curve with dots denotes the electron distribution profile along at the time indicated by the first vertical green line in (b), and its corresponding Liouville mapping distribution profile is shown by the red curve with dots (see the section “Liouville mapping of the electron crescents” and Table 1). e–i Comparison of the mapping distributions (red curve) with five observed ones color-coded on top of (c). The errors along velocity are from the energy resolution of FPI, and the electron distribution errors loaded from the MMS data files are from the noise of the particle measurements25.

