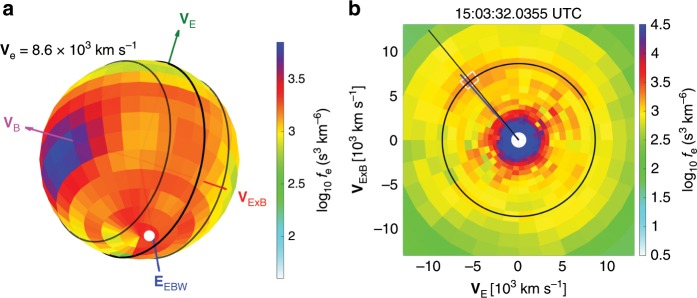
Fig. 7. Two-dimensional (2D) slice from 3D electron distribution functions.
a Electron distribution functions with electron kinetic velocity of 8.6 km s (corresponding to 212 eV). The green, magenta, and red arrowed lines denote the directions of VE, VB, and VE×B, respectively. The black circle represents the VE − VE×B plane perpendicular to the magnetic field B, and the two dashed circles show the ranges of away from the VE − VE×B plane. The blue arrowed line labeled as E, show the E direction of the EBWs. The white dot in panel (a) and the white square in panel (b) highlight the location with the largest phase-space density of the electron crescent. The intense phase-space densities close to the VB direction corresponds to the parallel magnetosheath electrons moving towards the X line (see Fig. 3f). b 2D slice of the distribution function on the VE − VE×B plane is from the average phase-space densities within from the perpendicular plane. The black circle denotes the electron velocity of 8.6 km s. The black and blue lines show the projected directions with the peak phase-space density of the electron crescents and the E direction, respectively.

