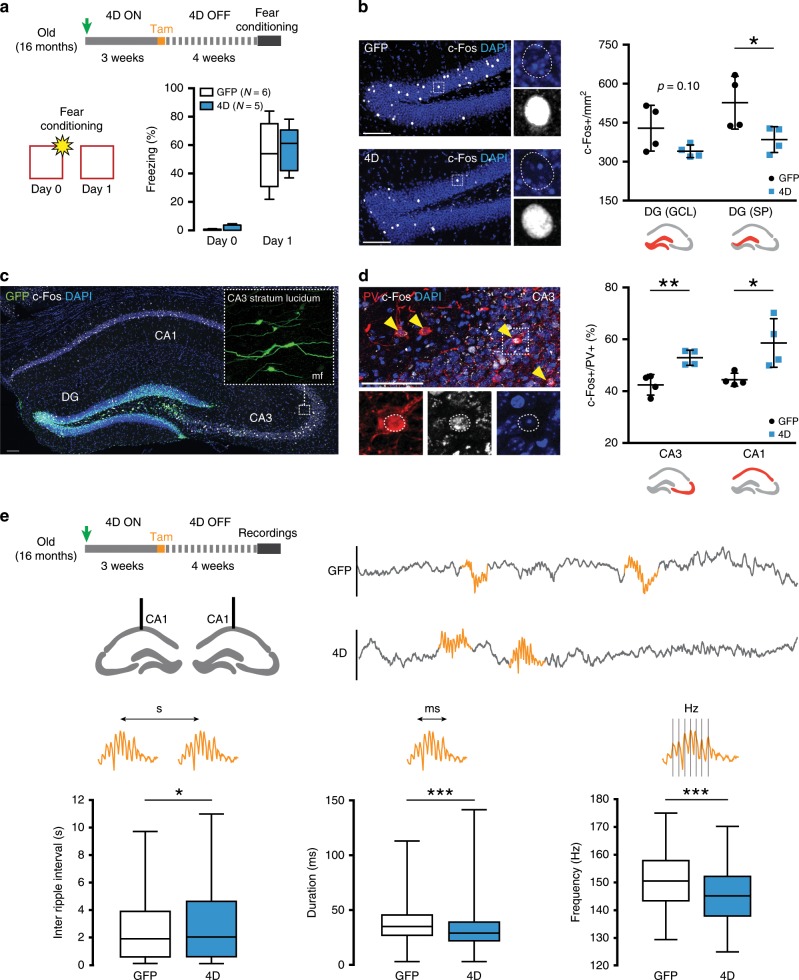
Fig. 2. Neurogenesis decreases overall hippocampal activity of aged mice.
a Experimental layout (top) and freezing responses (bottom) of 18 months old, GFP or 4D-treated mice subjected to a fear conditioning test 4 weeks after tamoxifen administration (as depicted) and used to assess neural activity in the trisynaptic hippocampal circuit by means of c-Fos quantification. b–d Immunohistochemistry fluorescence pictures with magnifications (left) and quantifications (right) for c-Fos in either the granule cell layer or suprapyramidal (SP) blade of the DG (b, as indicated) or in the Pv+ population (yellow arrowheads) of CA3 and CA1 (d, as indicated). Note the presence of GFP+ mossy fibres (mf) projections in the stratum lucidum of CA3. Data were expressed as c-Fos+ cells per DG area (b) or double positive for Pv in CA3 and CA1 (d, including the strata radiatum, lucidum, pyramidale and oriens, as well as the strata radiatum, pyramidale and oriens, respectively) scored in the dorsal hippocampus. Scale bars = 100 μm. e Experimental layout and schematic representation of brain recordings and local field potentials (top) of 18 months old GFP and 4D-treated mice used to assess sharp-wave ripples (orange lines) in natural drowsy state. Data (box–whisker plots, bottom) represent inter-ripple intervals (s), duration (ms) and internal frequencies (Hz). Note the subtle, but highly significant, changes observed in all parameters. N = 6 and 5 (a, box–whisker plots) or 4 (b, d, error bars = SD); n > 50 (d, CA3) and >10 (d, CA1). N = 4; n > 1500 ripples (e, box–whisker plots of the 10–90% quantile). *p < 0.05; **p < 0.01; ***p < 10−10 assessed by unpaired Student’s t test (a–d) and Kruskal–Wallis test (e).

