
Fig. 3. Fluence measurements.
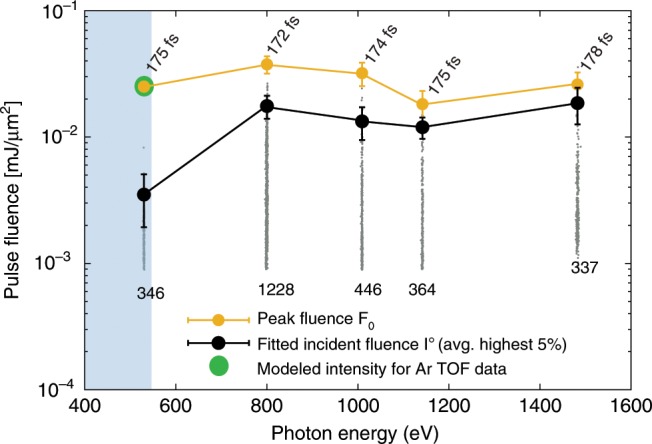
Comparison of the beamline peak fluence and the fitted incident fluence from the diffraction images. The fitted incident fluence () is obtained from diffraction images of sucrose clusters with sizes that fall within one standard deviation from the mean. The light gray points are all data and the black markers represent the 5% most intense hits at each photon energy. The peak fluence () is obtained from the beamline data and normalized to the Ar time-of-flight (TOF) data. The error bars of and are associated with the maximum uncertainty of the 5% most intense hits (see Supplementary Note 2). The shaded area indicates the water window. The numbers near the yellow points and gray points correspond to the pulse duration and number of recorded diffraction patterns, respectively.