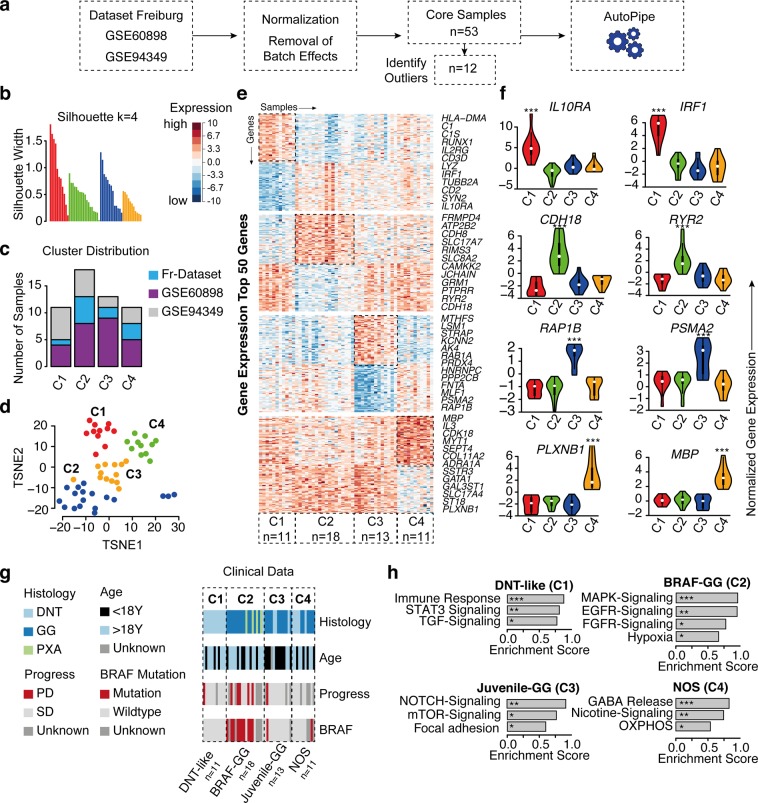
Figure 1.
Transcriptional signature of long-term epilepsy-associated tumors. (a) Illustration of the workflow. Dataset collection including our own cohort and 2 GEO databases, which were integrated into our analysis (GSE60898 and GSE94349). (b) Bar-plot of the silhouette widths of each patient based on the “PAM” cluster integrated in the AutoPipe-package (CRAN). The optimal number of clusters was computed by “PAM” clustering and visualized by the mean silhouette widths. Patients with negative silhouette widths were excluded. Full cluster are given in the Supplementary Fig. 1. (c) Sample distribution among all integrated datasets (d) tSNE visualization of the cohort. Colors indicate the cluster origin. (e) A heatmap with distinct up- and downregulated genes of each cluster group (C1–C4). Red indicates up-regulated gene expression, blue down-regulated genes, respectively. (f) Violin plot of distinct signature genes characteristic for each cluster. (g) Clinical information including histology, age, BRAF-mutation status and oncological course (progressive disease PD, or stable disease SD) (h) Gene Set Enrichment Analysis (GSEA) of each cluster group was performed and illustrated by bar-plots. P-values are determined GSEA and adjusted by False-Discovery Rate for multiple testing. Data is given as mean ± standard deviation; *p < 0.05, **p < 0.01, ***p < 0.001.

