Figure 4.
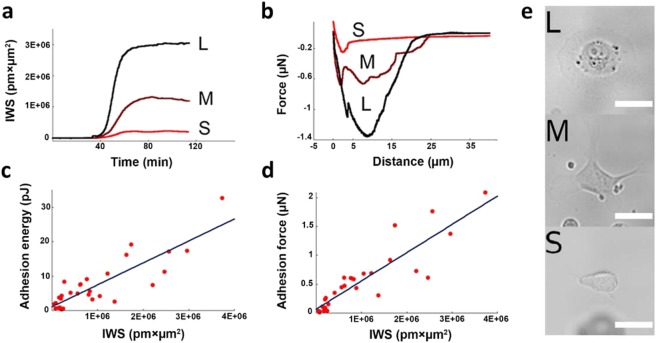
Calibration of the biosensor signal by FluidFM BOT measurements (a) Demonstration of the developed methodology: Individual cells are first let to spread and adhere in the biosensor device while their IWS signal is recorded. (b) Afterwards, the same single-cells are detached from the surface and their force-distance curves are measured using the FluidFM BOT device. (c,d) Correlation between the IWS signal and adhesion energies as well as IWS signal and adhesion forces measured in the experiments on the same single-cells. The linear correlation coefficients were determined as C = 0.8607 for the adhesion energy- and C = 0.8945 for the adhesion force versus the IWS recorded by the optical biosensor. (e) Corresponding brightfield microscopy images are also taken in order to facilitate the thresholding of the Cardio imager data. The scale bars represent 100 µm. (S, M and L marks a typical Small, Medium and Large sized cell, respectively.)

