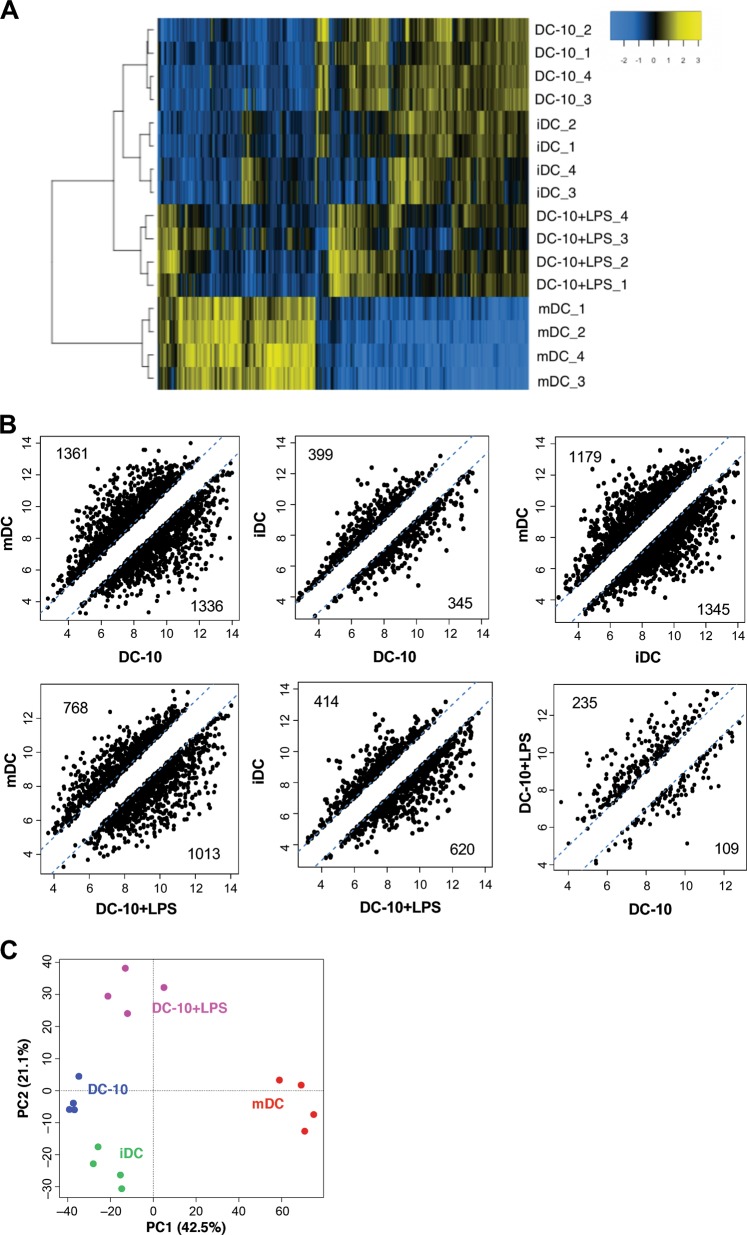
Fig. 1.
Transcriptional profile of in vitro differentiated DC-10. Mature (m)DCs, immature (i)DCs, DC-10, and DC-10 activated with LPS (DC-10+LPS) were differentiated in vitro from peripheral blood monocytes of healthy donors (n = 4) according to the Methods section, and microarray analysis was performed. a Two-dimensional heatmap of significant differentially expressed genes (DEGs) (P < 0.05, absolute fold change (FC) value >1). The color scale is relative to the mean expression levels. Genes are in columns, and samples are in rows. Data in rows have been hierarchically clustered. b Scatterplots of differential expression between mDCs, iDCs, DC-10, and DC-10+LPS. Each dot represents the averaged Log2 FC value of a single gene. Dashed diagonal lines indicate the thresholds for FC (absolute FC value >1). Numbers indicate DEGs. c Principal component analysis plot for expression data in mDCs, iDCs, DC-10, and DC-10+LPS

