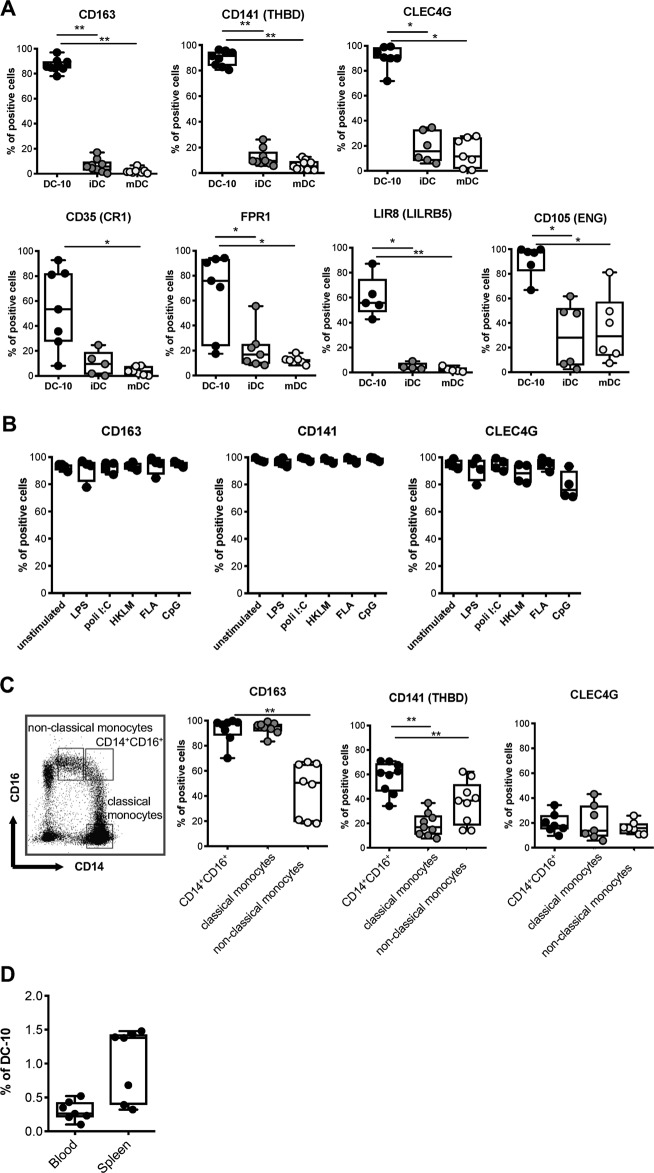
Fig. 3.
Co-expression of CD14, CD16, CD141, and CD163 identifies in vitro differentiated DC-10 and putative DC-10 in vivo. a DC-10, mDCs, and iDCs were differentiated in vitro from peripheral blood monocytes of healthy donors (n = 5–7) according to the Methods section. Expression levels of the indicated markers were measured by flow cytometry. The following gating strategy was applied: doublet exclusion, followed by alive cells and gating on CD11c+ cells. Each dot represents a single donor, lines indicate medians, and whiskers are minimum and maximum levels. b Expression levels of CD141, CD163, and CLEC4G were evaluated in DC-10 activated with the indicated TLRs at day 5 of differentiation (n = 4). The following gating strategy was applied: doublet exclusion, followed by alive cells and gating on CD11c+ cells. Each dot represents a single donor, lines indicate medians, and whiskers are minimum and maximum levels. c Expression levels of CD141, CD163, and CLEC4G were evaluated on CD14+CD16+ cells that contain DC-10, on CD14+CD16− (classical), and on CD14lowCD16+ (non-classical) monocytes (n = 7–9). The following gating strategy was applied: doublet exclusion, followed by alive cells and indicated gating. Each dot represents a single donor, lines indicate medians, and whiskers are minimum and maximum levels. d CD14+CD16+CD141+CD163+ cell frequencies in peripheral blood of healthy donors and in splenic CD45+ cells of cadaveric donors are shown (n = 7). Each dot represents a single donor, lines indicate medians, and whiskers are minimum and maximum levels. *P ≤ 0.05, **P ≤ 0.01 (Wilcoxon matched pairs test, two-tailed)

