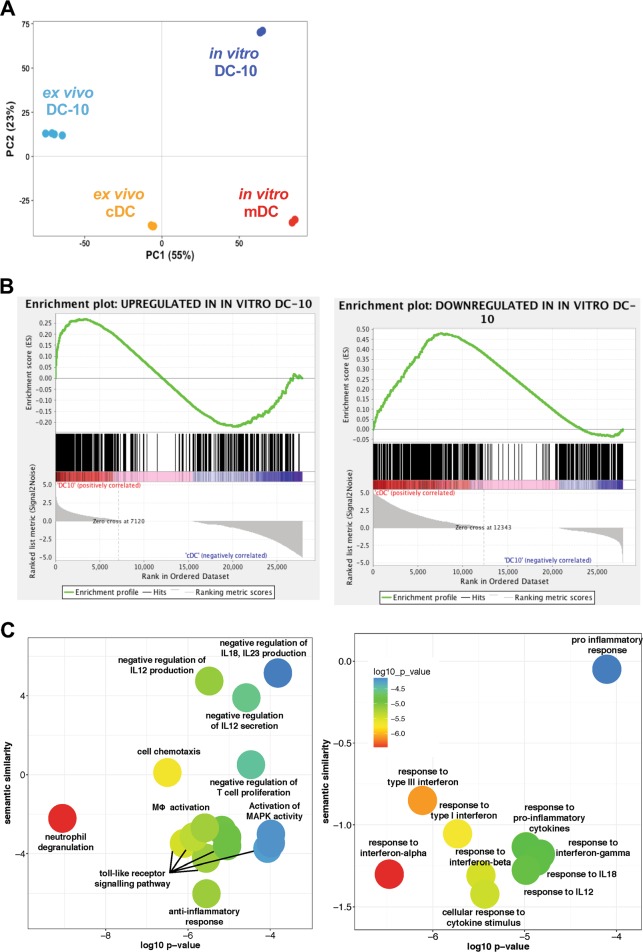
Fig. 7.
The Ex vivo DC-10 transcriptome resembles that of their in vitro counterpart. RNA was extracted from ex vivo DC-10 (n = 4) and from in vitro differentiated DC-10 and mDCs (n = 2) and sequenced. Published RNA-seq data of FACS-isolated cDCs (ex vivo cDCs, GSE70106) were used (n = 3). a Principal component analysis. PC variances are indicated on the axis, and each dot represents a donor and each subset is differently colored. b Gene Set Enrichment Analysis in ex vivo DC-10 and cDC transcriptomes of upregulated DEGs (left panel) and downregulated DEGs (right panel) in in vitro differentiated DC-10 compared to mDCs was performed. The enrichment profile is shown by the green line, while the hits are indicated by the black line. c The enrichment of biological process GO terms was analyzed with EnrichR and summarized using REVIGO. For each significant class (P < 0.01), enriched terms passing the redundancy reduction control are represented as scatterplots. Bubble colors indicate the P-value. The Y-axis indicates the semantic similarity between GO terms, whose units have no intrinsic meaning; semantically similar GO terms should cluster together in the plot. Pathways that are upregulated (left panel) and downregulated (right panel) are shown

