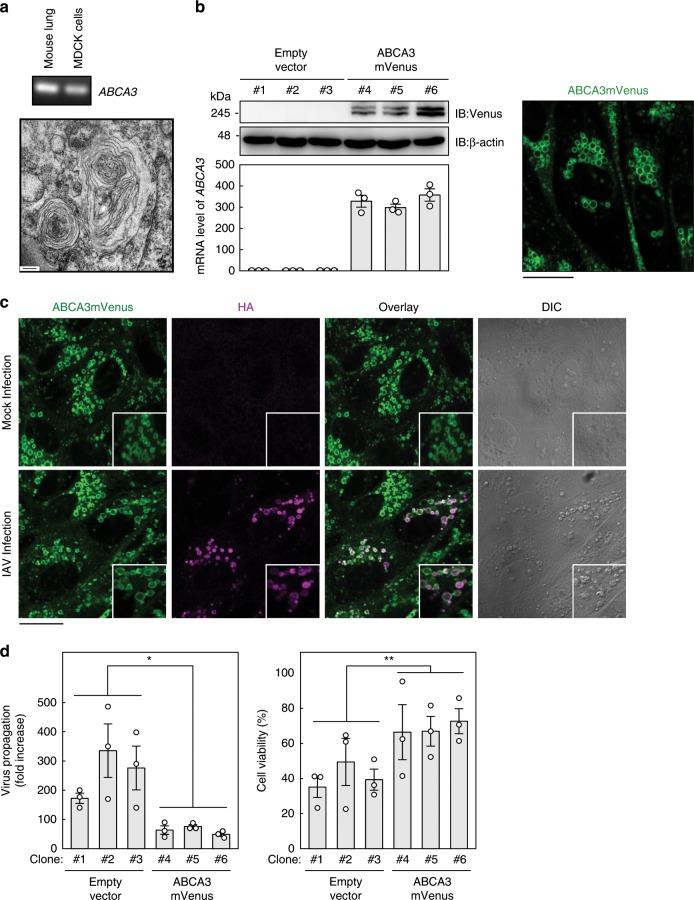
Fig. 4. Overproduction of the lamellar body inhibits virus propagation by sequestering newly synthesized HA.
a Relative mRNA level of ABCA3 in mouse lung and in MDCK cells analyzed by RT-PCR. The micrograph shows a typical image of a lamellar body detected in MDCK cells by electron microscopy. b Expression levels of ABCA3mVenus in MDCK-derived clones stably overexpressing ABCA3mVenus (clones 4–6) or transfected with empty vector (clones 1–3) analyzed by western blot using specific antibodies (IB; left upper panel). Upper and lower bands correspond to uncleaved and N-terminally cleaved forms of ABCA3mVenus, respectively. The mRNA level of ABCA3 in each clone was analyzed by quantitative RT-PCR (left lower panel). Data are presented as the relative amount of ABCA3 mRNA compared with the average of the three control clones (clones 1–3). Intracellular localization of ABCA3mVenus in clone 6 was analyzed by confocal microscopy (right panel). Similar images were obtained in clones 4 and 5. c Colocalization of HA with ABCA3 in clone 6. Clone 6 was not infected or infected with IAV strain PR8 at 10 MOI (lower panel) for 1 h. After washing, the cells were cultured for 15 h. Fluorescent images were analyzed using confocal microscopy. d The effects of ABCA3 overproduction on virus propagation and viral cytopathicity. Each MDCK clone was infected with IAV strain PR8 at 0.2 MOI for 16 h. The virus titer in the supernatant was determined by a plaque assay (left panel). Data are presented as a fold increase over the initial virus titer (60,000 pfu/ml). *P < 0.05 (by two-sided Student’s t test). Each MDCK clone was infected with IAV strain PR8 at 10 MOI for 1 h. After washing, the cells were cultured for 19 h (right panel). Cell viability was measured by cytopathicity assay. Data are presented as a percentage of the control value without infection. **P < 0.01 (by two-sided Student’s t test). All data are from three independent experiments (b and d, mean ± SEM). Scale bars represent 200 nm a or 20 μm b, c. Source data including uncropped western blot images are provided as a Source Data file.

