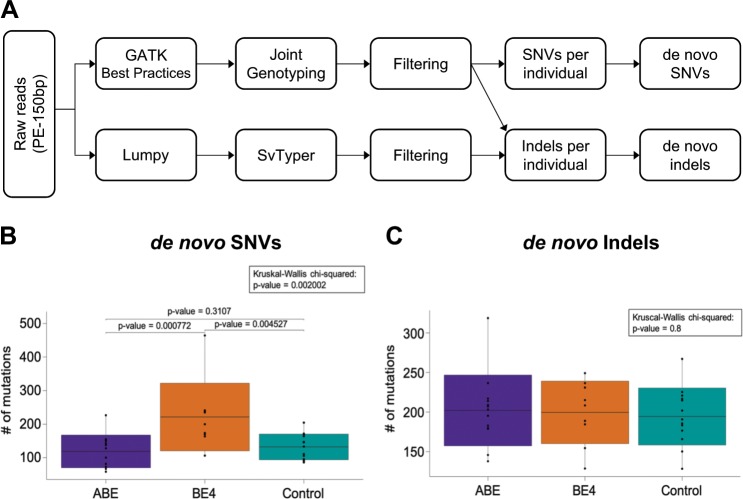
Fig. 2. De novo mutation frequencies in base-edited and control mice compared to their parents.
a Workflow of whole-genome sequencing analysis for SNVs and indels. b, c Numbers of de novo SNVs (b) and indels (c) identified in mutants (13 ABE-edited mice, n = 13; BE4-edited mice, n = 9) and controls (non-injected control mice, n = 13). Boxplot: center line, mean; box limits, plus and minus standard deviation; whiskers, minimum and maximum. Wilcoxon rank-sum test and Mann–Whitney-U-Test for the pairwise comparison were used to evaluate the statistical significance of differences between groups.

