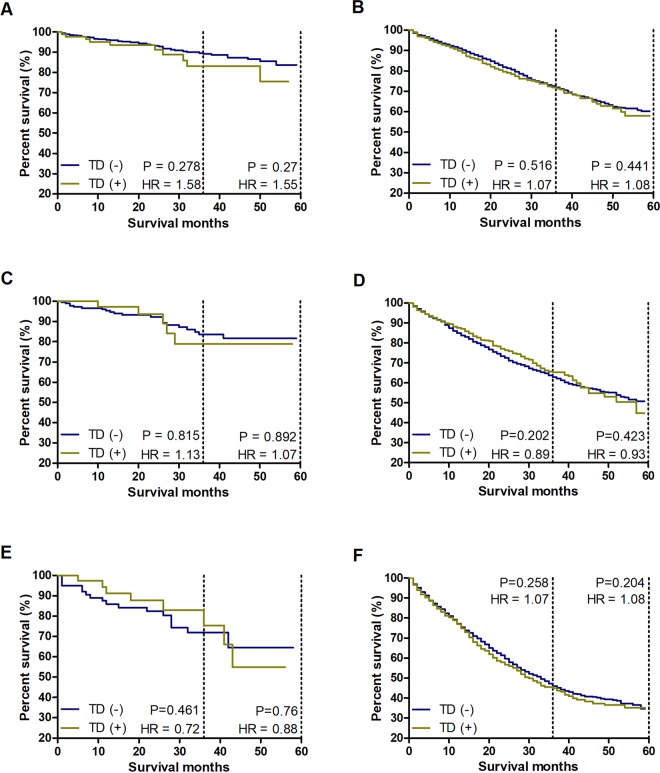
Figure 5.
Survival comparison between TD (+) and TD (−) patients in every T category with the same amount of mLNs. The number of mLNs is equal to the sum of the number of real mLNs and double the number of TDs. (A) Survival comparison between TD (+) and TD (−) T1/T2 patients with 2–3 mLNs. (B) Survival comparison between TD (+) and TD (−) T3/T4 patients with 2–3 mLNs. (C) Survival comparison between TD (+) and TD (−) T1/T2 patients with 4–6 mLNs. (D) Survival comparison between TD (+) and TD (−) T3/T4 patients with 4–6 mLNs. (E) Survival comparison between TD (+) and TD (−) T1/T2 patients with ≥7 mLNs. (F) Survival comparison between TD (+) and TD (−) T3/T4 patients with ≥7 mLNs.

