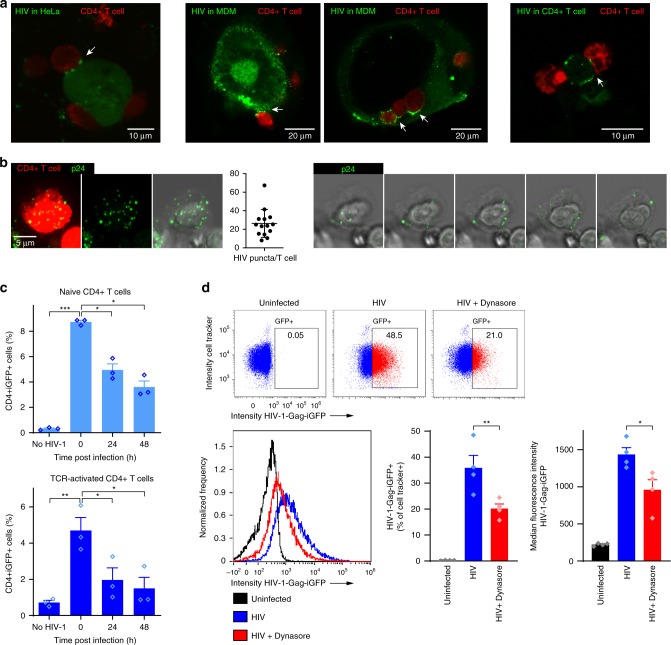
Fig. 1. HIV-1 is endocytosed and degraded by CD4+ T cells.
a HeLa cells expressing X4-tropic HIV-1-Gag-iGFP (green), primary human monocyte-derived macrophages (MDM) infected with cell-free HIV-1-Gag-iGFP_JRFL (R5 HIV-1), or primary CD4+ T cells infected with cell-free HIV-1-Gag-iGFP (X4 HIV-1) were co-cultured for 3 h with TCR-activated CD4+ T cells (Cell Tracker Deep Red) in the presence of the CXCR4 inhibitor, AMD3100 or the CCR5 inhibitor, Maraviroc. HIV-1 is accumulating in the virological synapse between donor and acceptor cell for all tested donor cell types. b CD4+ T cells were co-cultured with HEK293T cells expressing NLENG1-IRES (X4 HIV-1) for 24 h, trypsin treated for removal of extracellular virus and labeled with antibodies against HIV-1 p24. Maximum intensity projection images of a representative CD4+ T cell (stained with Cell Tracker Deep Red, left image panel), and quantification of the number of trypsin-resistant HIV puncta (identified by p24 staining, green) per acceptor T cell. Slices from a confocal z-stack through the same cell depicting HIV puncta in trypsin-resistant compartments (right image panel, every second slice is shown). c Frequency of trypsinized HIV-1-positive CD4+ T cells after co-cultured for 3 h with HIV-1-Gag-iGFP-expressing HeLa cells, analyzed by flow cytometry 0, 24, and 48 h post co-culture. Bars represent mean + SEM from three independent experiments. d CD4+ T cells were pre-treated with 80 µM Dynasore for 1 h prior to co-culture with HEK293T cells expressing HIV-1-Gag-iGFP (X4 HIV-1) for 24 h and analysis by imaging flow cytometry. Dot plot examples showing frequencies of trypsinized HIV-1-positive CD4+ T cells (top). Histogram overlay of median fluorescent intensity of Gag-GFP (left) and quantification (right). Bars represent mean + SEM from four independent experiments. Statistical significance was determined from log-transformed data by repeated measures two-way ANOVA with Dunnettʼs post-test in c and two-tailed paired t-test in d; significance levels: *p < 0.05; **p < 0.01; ***p < 0.001. Source data are provided as a Source Data File.

