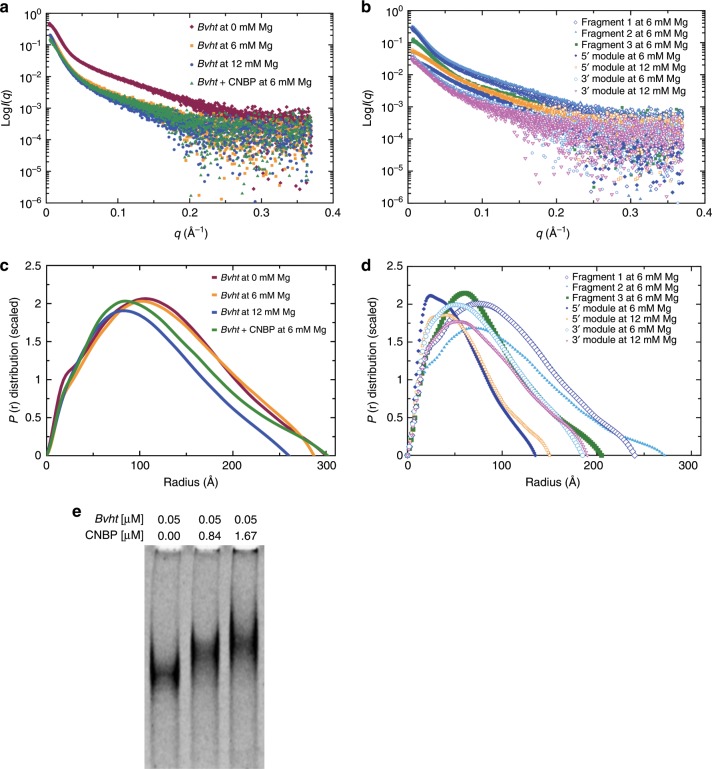
Fig. 1. SAXS and EMSA data for lncRNA Bvht.
a Scattering intensity vs. scattering angle (q = 4πsinθ/λ), indicating the dependence on Mg2+ concentration and effect of Bvht-CNBP complex formation. b Scattering intensity vs. scattering angle for isolated subregions of Bvht lncRNA. c Pair-distance distribution function for full-length Bvht at various Mg2+ concentrations and for Bvht-CNBP complex. d Pair-distance distribution function for subregions of Bvht. e EMSA for full-length Bvht with increasing CNBP concentrations.

