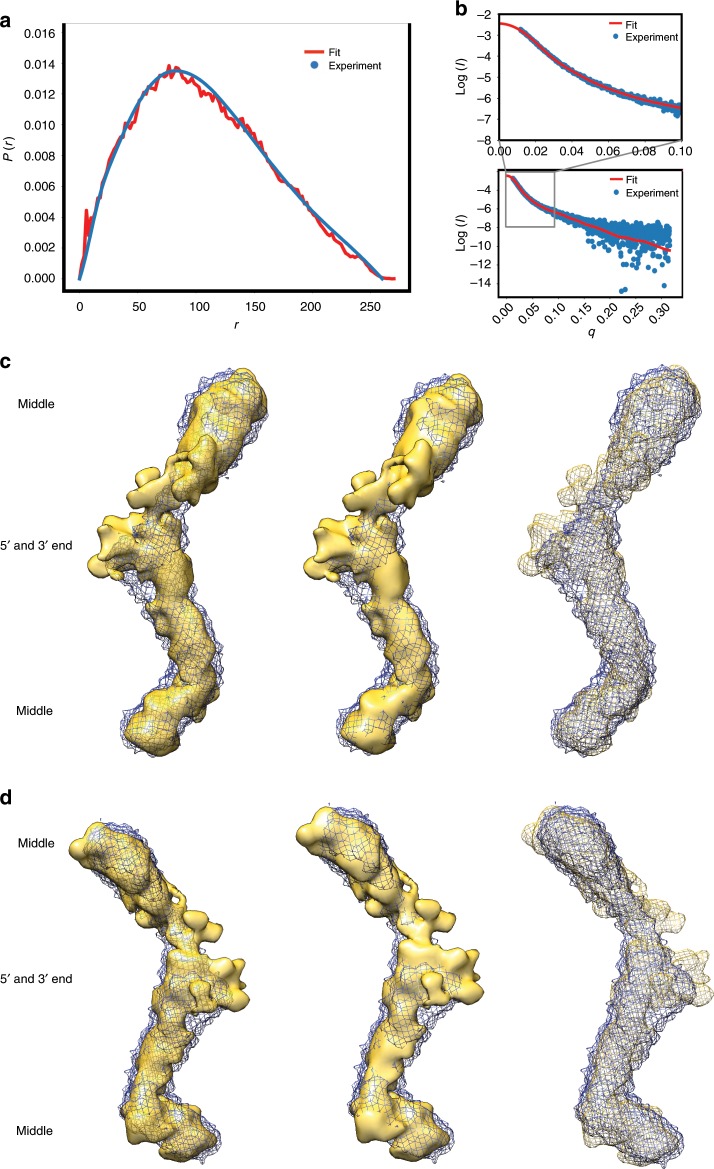
Fig. 5. Ensemble of atomistic models of Bvht matches measured SAXS data of Bvht at 12 mM Mg2+.
a Pair-distance distribution function displays agreement between experimental data (blue) and data back-calculated from computational models (red). b Scattering intensity vs. angle indicates agreement between experimental and model derived data. c A comparison of averaged solution structures of full-length Bvht derived from SAXS data (meshed blue) and an ensemble of computationally derived atomistic models (yellow) shows agreement (Supplementary Fig. 6 and Supplementary Fig. 7). SAXS measured structure was rendered with two different surface opacities and with wire mesh to clearly display surfaces of both SAXS measured solution structure and solution structure of ensemble atomistic model (left, low opacity; middle, high opacity; right, yellow wire mesh). d 180° view of (c). See Supplementary Movie 1 for 360° rotation.

