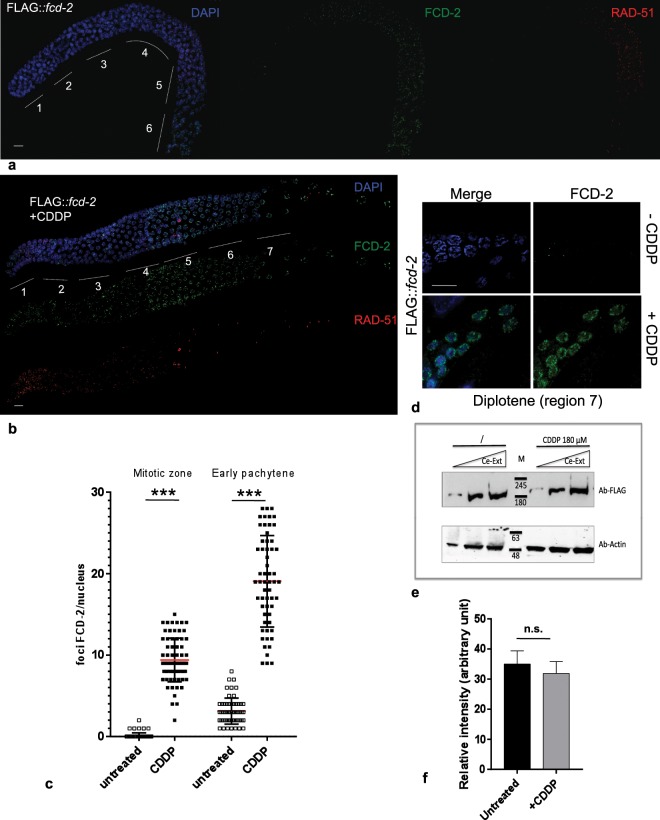
Figure 4.
Localization and expression of FLAG::FCD-2 after ICL damage in the C. elegans germline. (a) Representative image of gonad dissected from FLAG::fcd-2 transgenic hermaphrodite worm and co-stained with anti-FLAG antibody (green), anti-RAD-51 (in red) and DAPI (blue). Bar, 10 μm. (b) Representative image of gonad dissected from FLAG::fcd-2 transgenic hermaphrodite worm and co-stained with anti-FLAG antibody (green), anti-RAD-51 (in red) and DAPI (blue) after 48 hours CDDP treatment. Bar, 10 μm. Regions 1 and 2 consist of mitotic nuclei, region 3 consists of meiotic nuclei in transition zone (leptotene and zygotene). The regions 4, 5 and 6 correspond to early, middle and late pachytene respectively. The region 7 consists of diplotene nuclei. (c) Strip chart of FCD-2 foci in mitotic zone and early pachytene of FLAG::fcd-2 strain before and after 48 hours CDDP treatment. Each dot indicates the number of FCD-2 foci per nucleus. Red bar indicates the average for each different condition. Error bars correspond to SD calculated from at least three independent experiments. P value (Student’s t-test): ***P < 0.0001. (d) Representative images of diplotene nuclei in FLAG::fcd-2 transgenic hermaphrodites co-stained with anti-FLAG antibody (green), and DAPI (blue), untreated or treated with CDDP. Bar, 10 μm. (e) Western blot analysis of increasing amounts of protein extracts prepared from synchronized worms (FLAG::fcd-2 strain) treated or not with CDDP. The same filter was probed with antibodies against the indicated proteins. The panel shows different parts of the same filter probed with indicated antibodies. Anti -Actin was used as loading control. Data presented are representative of at least three independent experiments performed with at least three different amount of Protein extract. (f) Quantitation of FCD-2 levels normalized against Actin. Signal intensity of each band was measured using Quantity One software (Biorad). The y-axis represents the relative expression of FCD-2 in protein extracts from untreated worms and after CDDP treatment. Bars represent the means ± error standard from at least three independent experiments performed with three different amount of Protein extract for each experiment. P value (Student’s t-test): n.s. = no significant difference.

