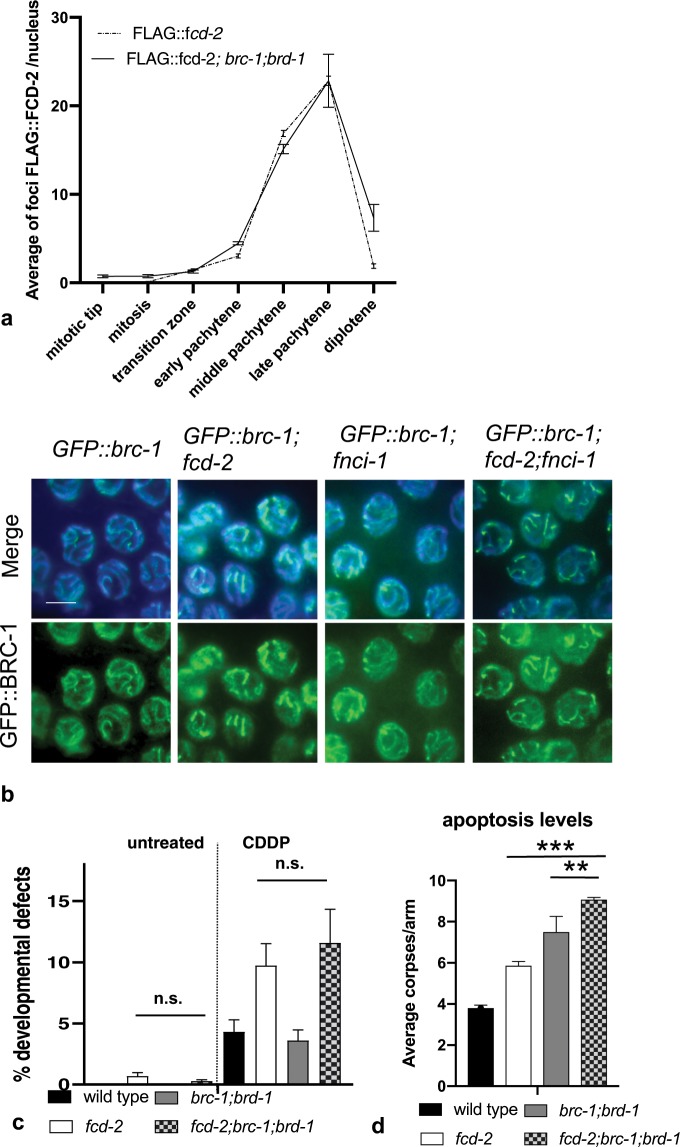
Figure 6.
Genetic interaction between FCD-2 and the BRC-1/BRD-1 complex. (a) Quantification of FLAG::FCD-2 foci in germline of FLAG::fcd-2 and FLAG::fcd-2; brc-1 brd-1 strains. The y-axis represents the average of FLAG::FCD-2 foci per nucleus. The x-axis represents the position (zone) along the germline. An average of 60 nuclei for each gonad region were scored for each genotype. Error bars correspond to SEM calculated from at least three independent experiments. (b) Representative images of the late pachytene nuclei in indicated genotypes co-stained with anti-GFP antibody (green), and DAPI (blue). Bar, 5μm. (c) Graphic representation of the percentage of developmental defects/hatched eggs in the indicated genotypes observed before and after 24–48 hrs treatment with 180 μM CDDP. Number of the developmental defects/hatched eggs observed: wt (N2) untreated = 0/2480; fcd-2 untreated = 15/2018; brc-1 bard-1 untreated = 0/3972; fcd-2; brc-1 bard-1 untreated = 5/1810; wt (N2) CDDP = 30/696; fcd-2 CDDP = 60/617; brc-1 bard-1 CDDP = 50/1390; fcd-2; brc-1 bard-1 CDDP = 38/328. Developmental defect phenotypes observed: dumpy, long, multivulva, roller, small, uncoordinated, larval arrest, vulvaless, vulva protrusion, bag of worm. Error bars correspond to SD calculated from at least three independent experiments. P value (x2 test): n.s. = no significant difference. (d) Quantification of germline apoptosis in the indicated genotypes. The y-axis shows the average number of SYTO-12-labeled nuclei per gonadal arm. Number of observed gonad: wt: 84; fcd-2: 109; brc-1 brd-1: 73; fcd-2; brc-1 brd-1: 74. Error bars correspond to SD calculated from at least three independent experiments. P value (Student’s t-test): **P < 0.05; ***P < 0.0001.

