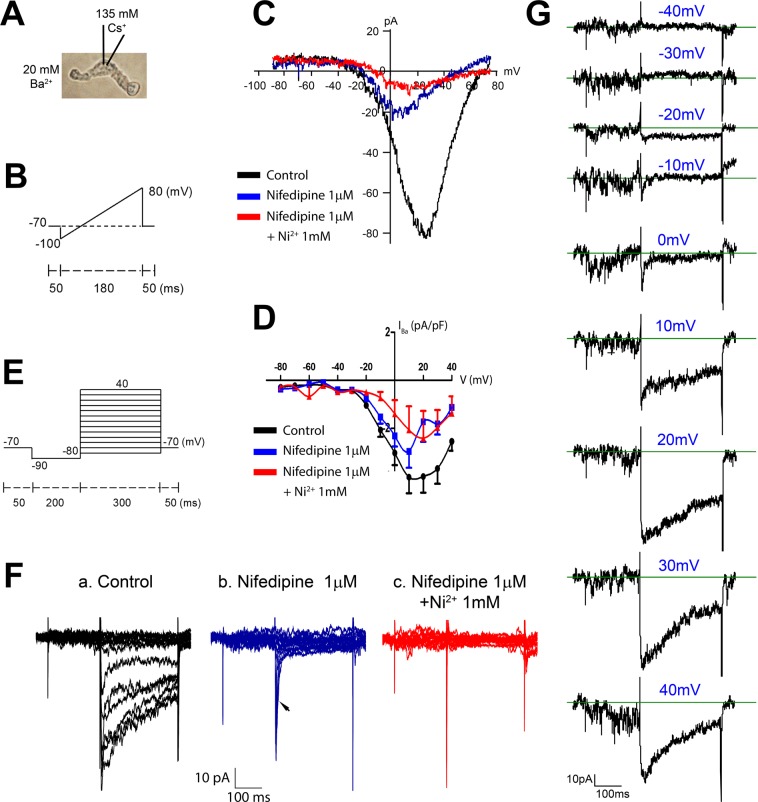
Figure 4.
Whole-cell patch clamp recordings of VGCC current in LMCs isolated from WT mouse IALs. (A) Brightfield image of an isolated LMC with the major components of the pipette and bath solutions indicated. (B) Ramp protocol to estimate I-V relationships. (C) Example I-V curve for an LMC under control conditions (black), after addition of 1 μM nifedipine (blue), which blocked ~80% of the current and shifted the peak from +20 to 0 mV, and after addition of 1 μM nifedipine + 1 mM Ni2+ (red), which blocked almost all of the remaining current. (D) Summary I-V curves for 5 LMCs isolated from mouse IALs studied with the protocol shown in (B,C). (E) Voltage step protocol. (F) Example recordings from a LMC using the voltage step protocol, showing (a) the initial whole-cell current, (b) inhibition of the long-lasting component of the inward current by nifedipine but preservation of a transient inward current (arrow), and (c) elimination of all inward current in 1 μM nifedipine + 1 mM Ni2+ (the three remaining spikes are capacitance artifacts and are also present in the other recordings). (G) The same traces as in panel Fa except stacked vertically to show the small transient inward currents that activate at the beginning of the steps to −10 and 0 mV (and are then masked by the longer lasting components at more positive voltage steps).

