Figure 5.
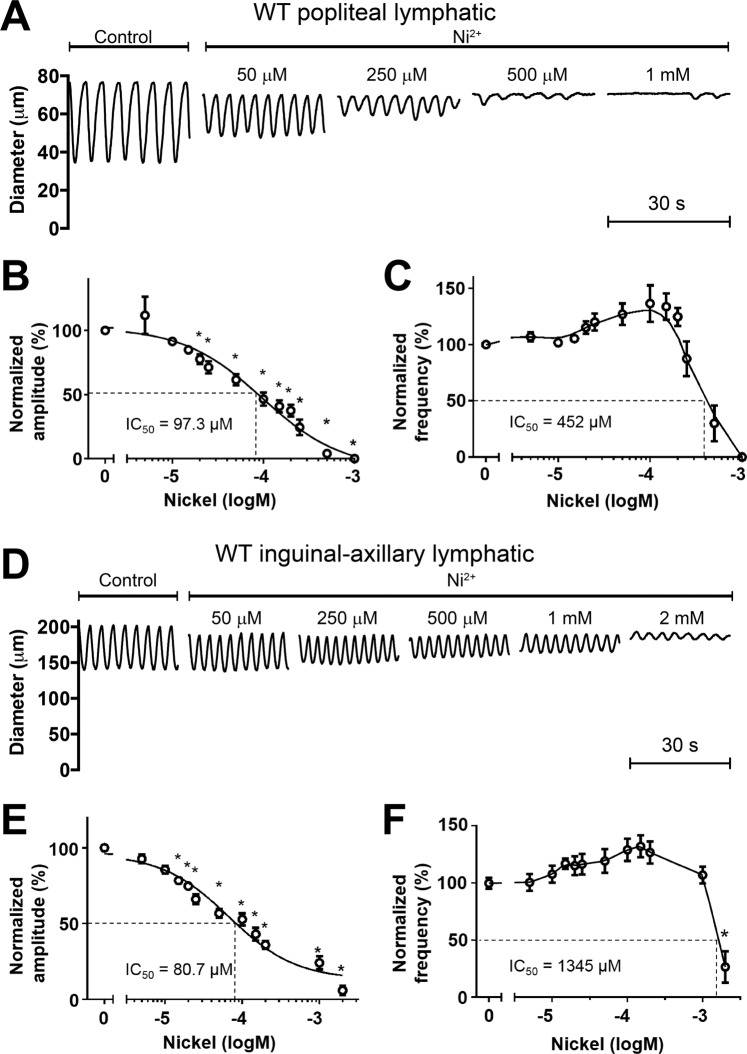
Responses of PLs and IALs from WT mice to Ni2+. (A) Example recording of spontaneous contractions in a PL before and after 4 different concentrations of Ni2+, showing a slight increase in FREQ at the two lowest concentrations compared to progressive reduction in AMP at all four concentrations. (B,C) Summary of contraction data for 8 PLs in response to 12 concentrations of Ni2+, given cumulatively. The increase in FREQ at concentrations below 0.3 mM is also evident in the graph in (C). (D) Example recording of spontaneous contractions of an IAL before and after 5 different concentrations of Ni2+. (E,F) Summary data for 8 IALs in response to 11 different concentrations of Ni2+. Again, there is a tendency for FREQ to increase, or be unaffected at concentrations below 1 mM, before declining substantially at 2 mM.

