
Figure 3:
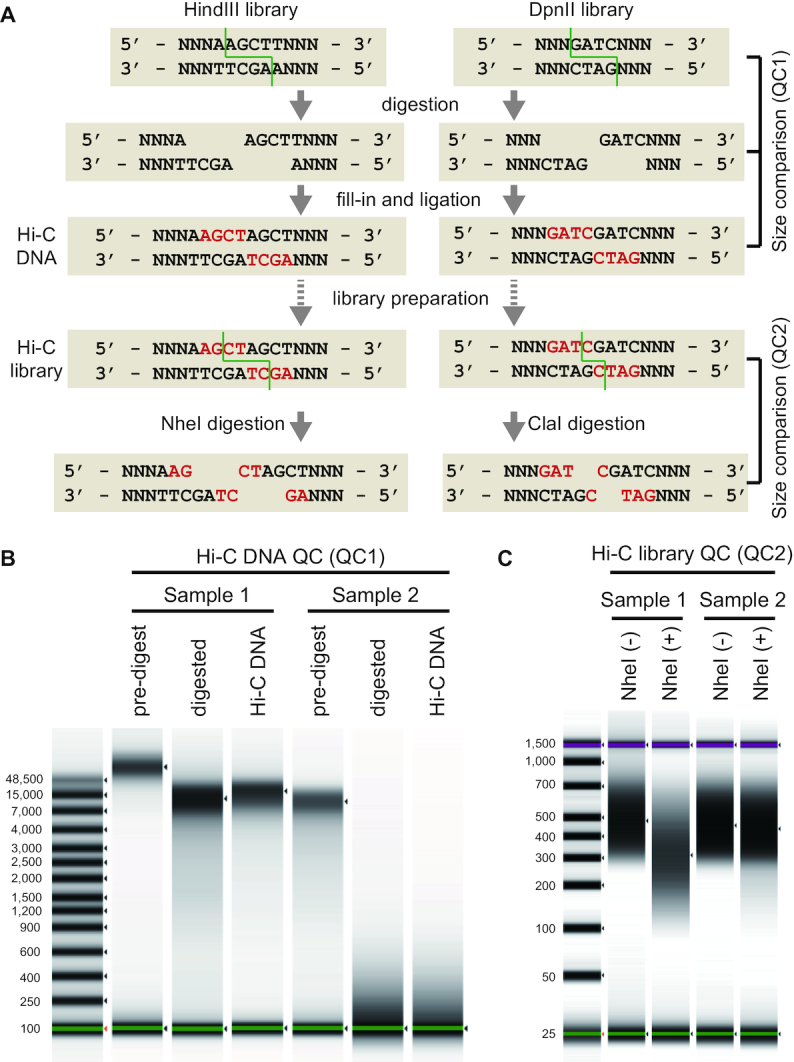
Structure of the Hi-C DNA and principle of the quality controls. (A) Schematic representation of the library preparation workflow based on HindIII or DpnII digestion. The patterns of restriction are indicated by the green lines. The nucleotides that are filled in are indicated by the letters in red. (B) Size shift analysis of HindIII-digested Hi-C DNA (QC1). Representative images of qualified (Sample 1) and disqualified (Sample 2) samples are shown. (C) Size shift analysis of the HindIII-digested Hi-C library (QC2). Representative images of the qualified (Sample 1) and disqualified (Sample 2) samples are shown. Size distributions were measured with Agilent 4200 TapeStation.