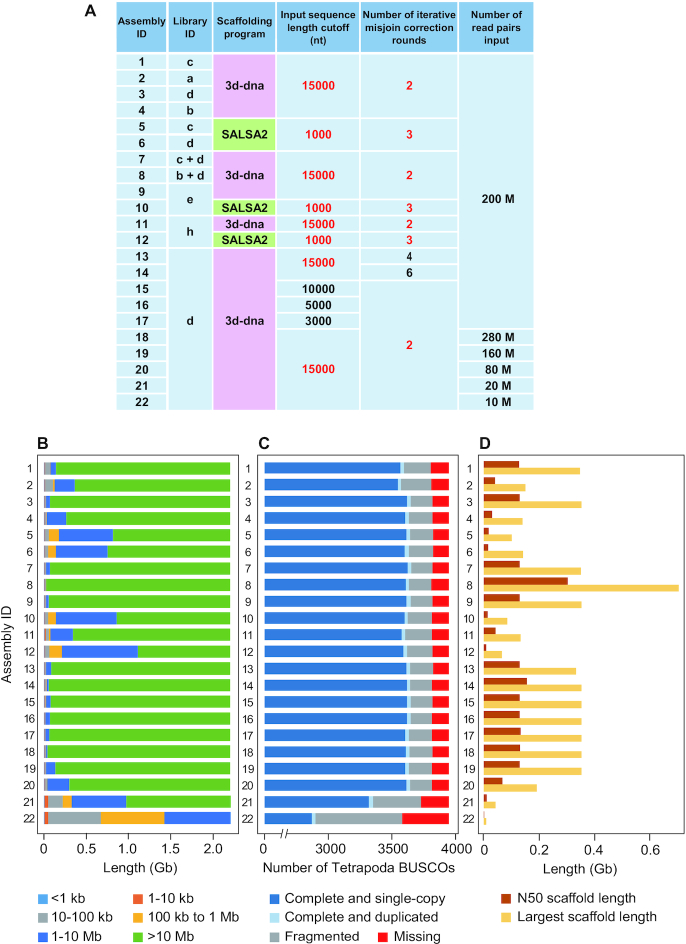
Figure 9:
Comparison of Hi-C scaffolding products. (A) Scaffolding conditions used to produce Assembly 1–22. The default parameters are shown in red. (B) Scaffold length distributions. (C) Gene space completeness. (D) Largest and N50 scaffold lengths. See panel A for Library IDs and Supplementary Table S6 for raw values of the metrics shown in B–D. nt: nucleotides.

