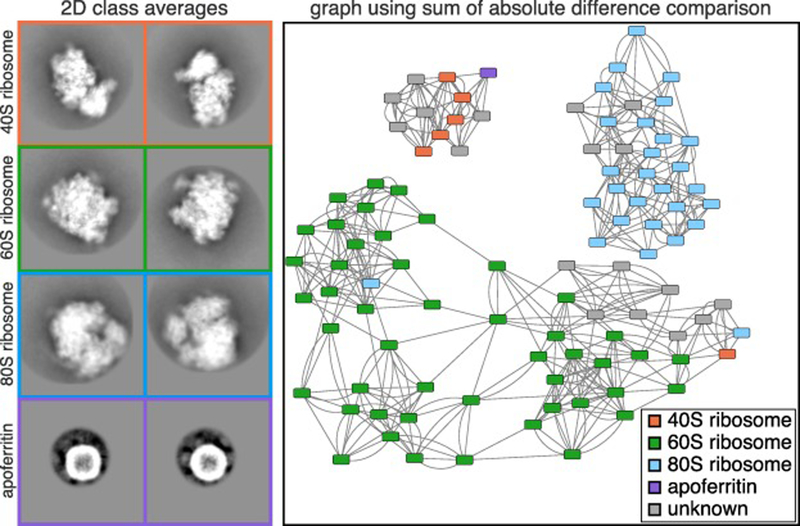
Figure 3. Experimental 2D class averages and resulting network.
Cryo-EM data was collected on a mixture of 5 protein and protein-nucleic acid complexes. Representative 2D class averages of the 4 complexes identified in the mixture are shown on the left. The identity of each class average was manually annotated were it could be easily identified. The class average corresponding to apoferritin was further subdivided into multiple classes for visualization. Each box corresponds to a width of 422 Å. The network displayed was generated after using SLICEM on the 100 2D class averages scored using the sum of the absolute difference metric. Nodes representing each 2D class averages are colored by their putative structural identity and are connected to their 5 most similar class averages.

