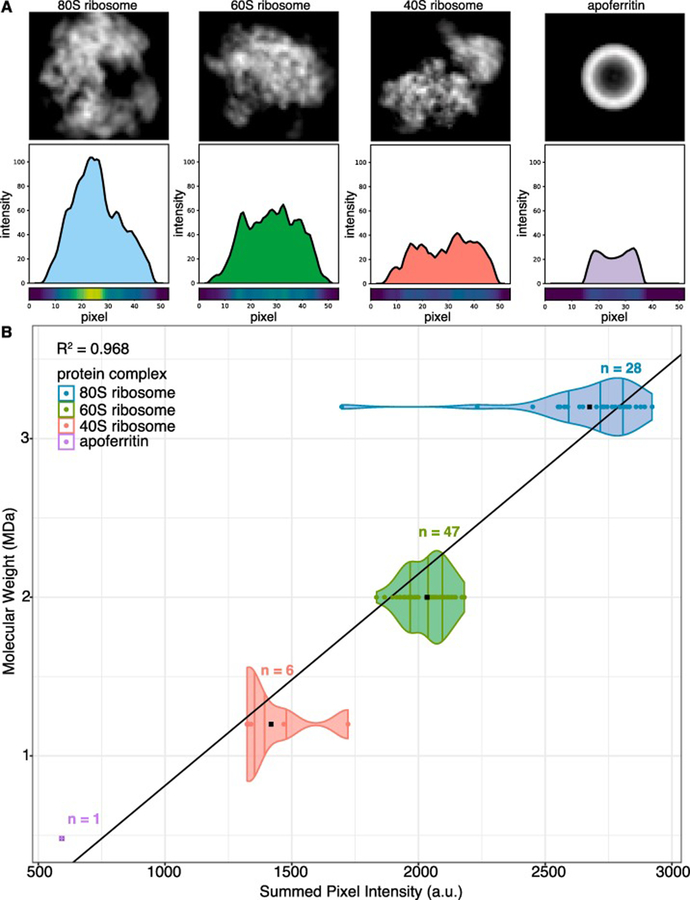
Figure 4. Summed pixel intensities of 2D class averages correlate to molecular weight.
(A) 2D to 1D projections (projection angle orthogonal to the x-axis) for representative 2D class averages of each structure present in the mixture. 1D projection plots show the line profile for a single 1D projection of each 2D class average. Pixel heat maps show the intensity of the line profile at each pixel. (B) Distribution of the summed pixel intensities calculated for each 2D class average. Summed pixel intensities for each manually identified 2D class average are plotted against their respective molecular weight. Black points are the mean summed pixel intensity for each structure and n indicates the number of 2D classes for each structure.

