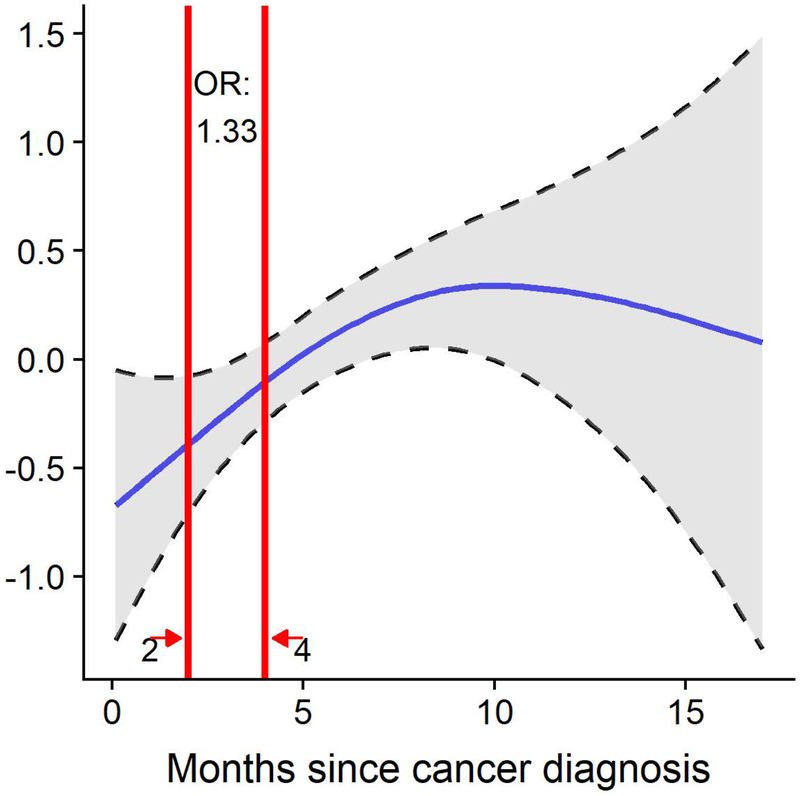
Fig. 2.
Formal Social Resource Use over Time. The figure depicts the results of the generalized additive models regressing formal social resource use on time since diagnosis as a non-linear term. Unadjusted odds ratio comparing caregivers at 4 versus 2 months post cancer diagnosis is depicted. Data are from the Comprehensive Health Enhancement Support System (CHESS) – Prolonging Life study (2009–2012; n=202).

