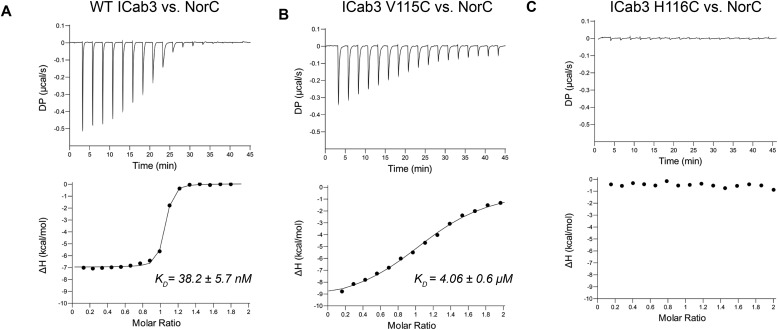
Figure 3.
Binding analysis of ICab3 and its mutants with NorC. A, ITC profile (top, differential power; bottom, binding isotherms with integrated peaks normalized to moles of injectant and offset-corrected) showing nanomolar affinity of WT ICab3 with NorC. B, the binding affinity decreases 100-fold in the case of ICab3 V115C mutant. C, ICab3 H116C has no affinity for NorC.

