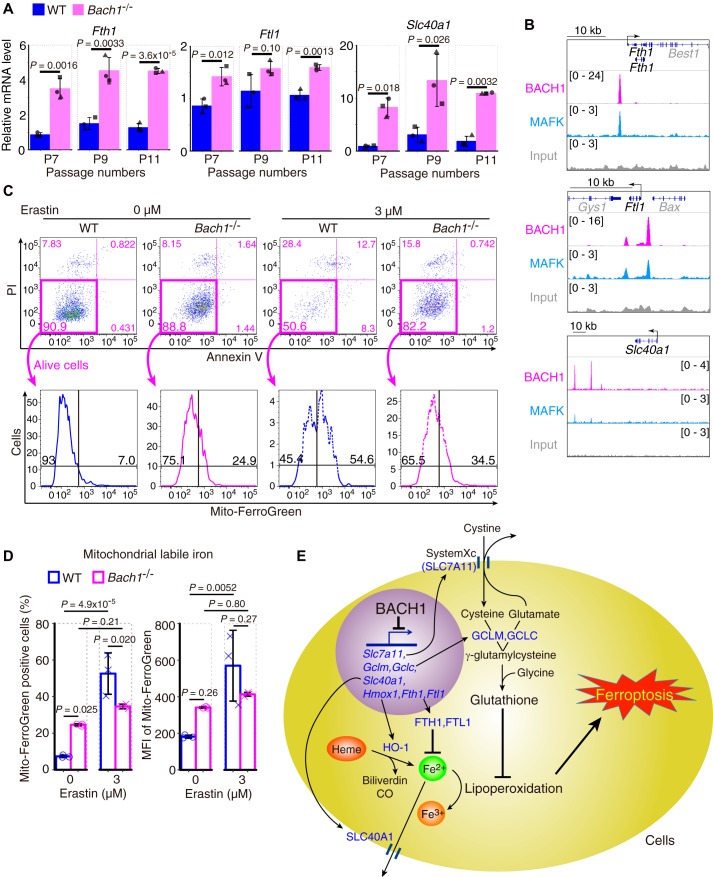
Figure 4.
BACH1 increases mitochondrial labile iron during ferroptosis by repressing the transcription of genes of ferritin and ferroportin. A, qPCR analysis for Fth1, Ftl1, and Slc40a1 mRNA relative to Actb mRNA in WT and Bach1−/− MEFs (7th, 9th, and 11th passage: P7, P9, and P11). n = 3 of independent lots of MEFs per genotype. B, ChIP-seq analysis of the binding of BACH1, MAFK for gene regions of Fth1, Ftl1, and Slc40a1 in M1 cells. C and D, WT and Bach1−/− MEFs (P8) were exposed to erastin for 24 h and afterward, stained by Mito-FerroGreen, a fluorophore. Representative flow cytometry images (C) showing the strategy that was implemented for the sorting of Mito-FerroGreen positive cells. The positive cells were judged as mitochondrial-labile iron positive cells. Quantification of mitochondrial-labile iron (D). MFI, mean fluorescence intensity. E, conceptual diagram. Error bars of A and D represent S.D. p value of A by t test. p value of D by Tukey's test after two-way ANOVA.

