Figure 5.
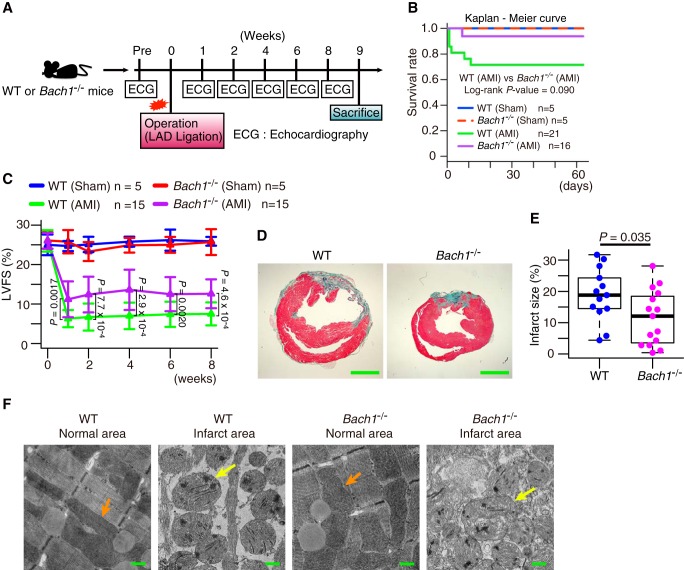
BACH1 aggravates AMI. A, experimental process. B, Kaplan-Meier curve of each group. C, left ventricular fractional shortening (LVFS) on echocardiogram. D and E, mice was dissected after 9 weeks from operation. D, representative photographs of heart sections stained with elastica Masson staining. E, infarct size to left ventricular section. Scale bars in D represent 2 mm. F, mice was dissected next day from operation. Transmission electron microscope image of normal and infarct area of hearts of mice next day from operation. Orange arrow: normal mitochondria. Yellow arrow: mitochondrial spheroid-like abnormality. Scale bars represent 500 nm. Error bars of C represent S.D. The box and whisker plots of E show the 25th and 75th percentile quartiles and median values (center black line) and maximum and minimum values of the data. p value of B by log-rank test between WT (AMI) and Bach1−/− (AMI). p value of C by Tukey-Kramer method after two-way ANOVA. p value of E by t test.

