Figure 1.
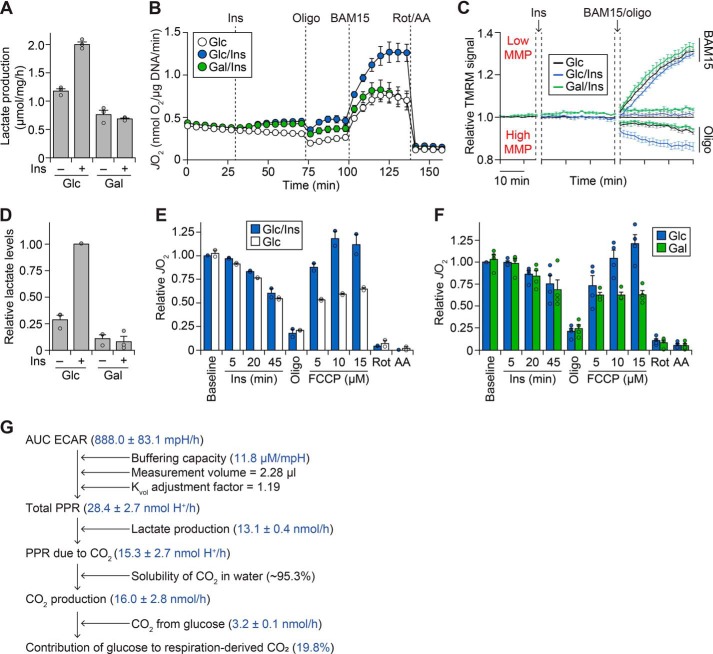
Glucose is dispensable for insulin-stimulated respiration in adipocytes. A, 3T3-L1 adipocytes were treated for 1 h with or without 100 nm insulin (Ins) in Medium BS, supplemented with 25 mm glucose (Glc) or galactose (Gal). Following treatment, lactate production was quantified enzymatically as described under “Experimental procedures.” Data are presented as mean ± S.E. (error bars) from three separate experiments. B, 3T3-L1 adipocytes were incubated in Medium CX supplemented with 25 mm Glc or Gal, and JO2 was measured using the XFp Analyzer following sequential treatment with or without Ins (100 nm), oligomycin (Oligo; 10 μg/ml), BAM15 (10 μm), rotenone (Rot; 5 μm), and antimycin A (AA; 10 μm) at the time points indicated. Data are presented as mean ± S.E. from four separate experiments. C, 3T3-L1 adipocytes were preloaded with TMRM dye, and fluorescence was measured following incubation in Medium CX supplemented with 25 mm Glc or Gal, treatment with Ins (100 nm), and treatment with Oligo (10 μg/ml) and BAM15 (10 μm) as indicated. Fluorescence was normalized to the Glc/control condition (for details, see “Experimental procedures”). Data are presented as mean ± S.E. from five separate experiments. D–F, mature primary adipocytes were isolated from rats and incubated in assay buffer supplemented with 5 mm Glc or Gal. In D, adipocytes were treated without (control; Ctrl) or with Ins (20 nm) for 1 h. Following treatment, lactate content was determined enzymatically following organic extraction and normalized to the Glc/Ins condition. Data are presented as mean ± S.E. from three separate experiments. In E, respiration was measured using the Oroboros O2K following the addition of Ins (20 nm), Oligo (5 μg/ml), FCCP (concentrations as indicated), Rot (10 μm), and AA (25 μm). Respiration was normalized to the baseline respiration of the Glc/Ins condition. Data are presented as mean ± half-range from two separate experiments. F, respiration was measured as in E. Data are presented as mean ± S.E. from four separate experiments. G, schematic depicting how the contribution of glucose to respiration-derived CO2 was determined using ECAR, lactate production, and glucose oxidation data. For details, see “Experimental Procedures” and “Results.” Data are presented as mean ± S.E., derived from experiments described in the “Experimental Procedures” and “Results.” AUC, area under the curve.

