Figure 2.
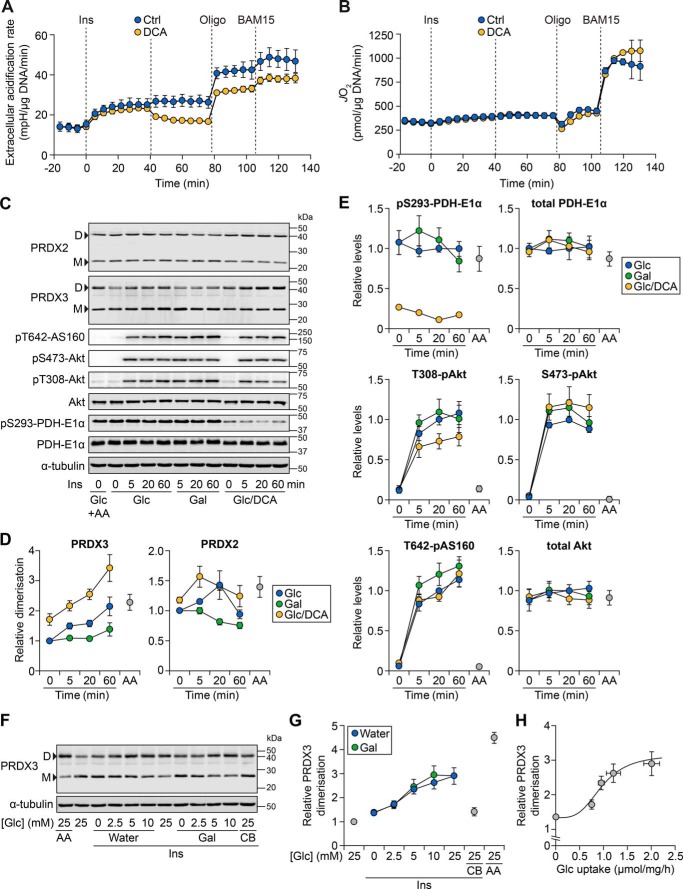
Glucose is required for insulin to increase mitochondrial oxidant levels. A and B, 3T3-L1 adipocytes were incubated in Medium CX supplemented with 25 mm glucose (Glc) and ECAR (A) or JO2 (B) was measured using the XFp Analyzer following sequential treatment with insulin (Ins, 100 nm), DCA (1 mm), oligomycin (Oligo; 10 μg/ml), and BAM15 (10 μm). Data are presented as mean ± S.E. (error bars) from four separate experiments. C, 3T3-L1 adipocytes were serum-starved in Medium BS with 25 mm Glc. During the last 1 h of serum starvation, cells were pretreated with DCA (1 mm) or antimycin A (AA; 50 nm). Cells were then incubated in Medium BS, supplemented with 25 mm Glc or galactose (Gal), with Ins (100 nm) and DCA (1 mm) for the indicated times. Following treatment, cells were harvested, and lysates were subjected to Western blotting with antibodies against the indicated proteins. Data are representative of four separate experiments. D, dimer; M, monomer. D, densitometry of PRDX2 and PRDX3 bands from C, expressed as a ratio of dimer to monomer bands and made relative to the treatment with Glc at t = 0 min. Data are presented as mean ± S.E. from four separate experiments. E, densitometry of the indicated proteins from C, normalized to α-tubulin and made relative to the Glc/t = 20 min condition. Data are presented as mean ± S.E. from four separate experiments. F, 3T3-L1 adipocytes were serum-starved and then incubated in Medium BS with Ins (100 nm), AA (50 nm), and/or cytochalasin B (CB; 25 μm). This treatment medium was also supplemented with the indicated concentration of Glc, with the final volume balanced with either water or Gal (for the latter, the final combined sugar concentration was 25 mm). Following 1 h of treatment, cells were harvested and lysates were subjected to Western blotting with antibodies against the indicated proteins. Data are representative of four separate experiments. G, densitometry of PRDX3 bands from F, expressed as the ratio of dimer to monomer bands and made relative to the treatment with 25 mm Glc without Ins (second lane in F). Data are presented as mean ± S.E. from four separate experiments. H, PRDX3 dimerization (G) plotted against Glc uptake (Fig. S2C) for Ins-treated cells exposed to varying medium Glc concentrations (where the final volume was balanced with water). The Hill equation was fitted based on individual data points and overlaid onto the data, which are presented as mean ± S.E. from four separate experiments.

