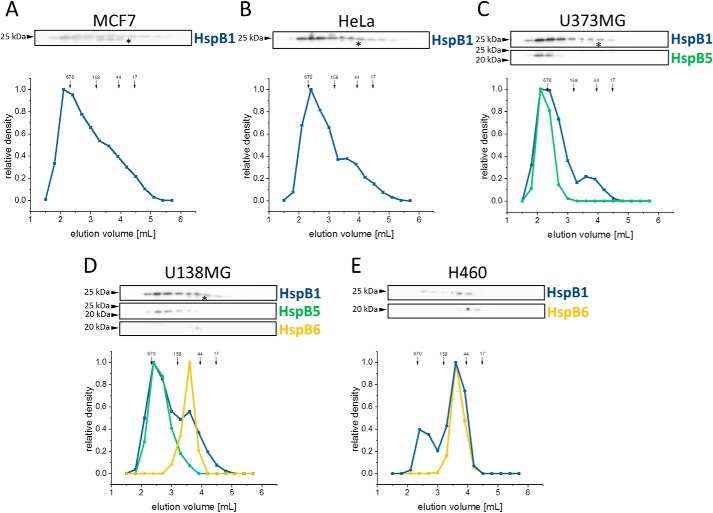
Figure 2.
Size distribution of endogenously-expressed sHsps under ST conditions in five human cancer cell lines. 0.5 mg of soluble lysate fraction of different cancer cell lines was applied directly after mechanical lysis onto an SEC column. Subsequently, the fractions were analyzed by Western blotting. The relative content of the sHsp was quantified by means of densitometry blots depicted as a graph. MCF7 (A) and HeLa (B) expressing only HspB1 (blue) were used as reference. Elution profiles of sHsps from U373MG cells expressing HspB1 and HspB5 (green) (C), U138MG cells expressing HspB1, HspB5, and HspB6 (yellow) (D), and H460 cells expressing HspB1 and HspB6 (E) are shown. Positions of molecular mass standards (in kDa) are indicated with arrows. Double bands of HspB1, labeled with an asterisk, are commonly observed.

