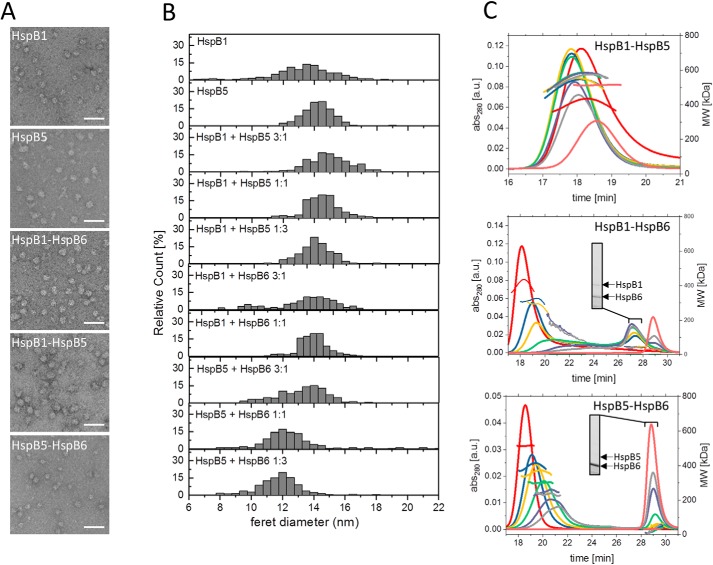
Figure 4.
Size distribution of sHsp hetero-oligomers formed at different ratios in vitro. A, representative electron micrographs of negatively-stained HspB1 and HspB5 homo-oligomers and hetero-oligomers of HspB1, HspB5, and HspB6 were formed at a 1:1 ratio. Scale bars indicate 50 nm. B, size distributions of homo-oligomers formed at different ratios determined from the Feret diameters of 10,000 negatively-stained particles. HspB6 alone and HspB1–HspB6 hetero-oligomers formed at 1:3 ratios are not included as they are too small to be discerned. C, size distributions of hetero-oligomers formed at different ratios determined by SEC-MALS. Left y axis: UV absorption at 280 nm; right y axis: molecular weight determined by MALS using RI signal. SDS-PAGE analyses of peak fractions are depicted as insets (see Fig. S4 for complete SDS-PAGE analysis). Colors indicate varying ratios of sHsps at constant total protein concentrations (red, 1:0; blue, 3:1; yellow, 2:1; green, 1:1; purple, 1:2; gray, 1:3; pink, 0:1).

