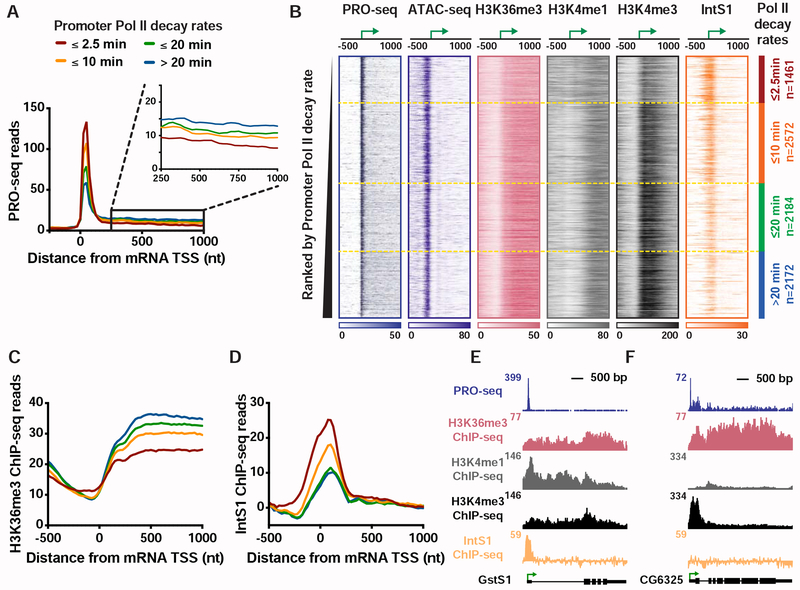
Figure 1. Genes with unstable promoter Pol II are characterized by poor transcription elongation and enriched binding of Integrator.
(A) The average distribution of PRO-seq signal is shown at mRNA transcription start sites (TSSs), with genes divided into four groups based on Pol II promoter decay rates following Triptolide treatment (groups defined in Henriques et al., 2018). Inset shows the gene body region. Read counts are summed in 25-nt bins.
(B) Heatmap representations of PRO-seq and ATAC-seq signal, along with ChIP-seq reads for H3K36me3, H3K4me1 and H3K4me3 histone modifications and the Integrator subunit 1 (IntS1). Data are aligned around mRNA TSSs, shown as a green arrow (n=8389). Data are ranked by Promoter Pol II decay rate, where promoters with fastest decay rates (≤2.5 min) are on top. Dotted line separates each group of genes.
(C and D) Average distribution of (C) H3K36me3, and (D) IntS1, ChIP-seq signal is shown, aligned around TSSs and divided into groups based on Pol II decay rate, as in A.
(E and F) Example gene loci representative of genes in the (E) fast, or (F) slow, Pol II promoter decay groups displaying profiles of PRO-seq and ChIP-seq signals, as indicated.
See also Figure S1.

