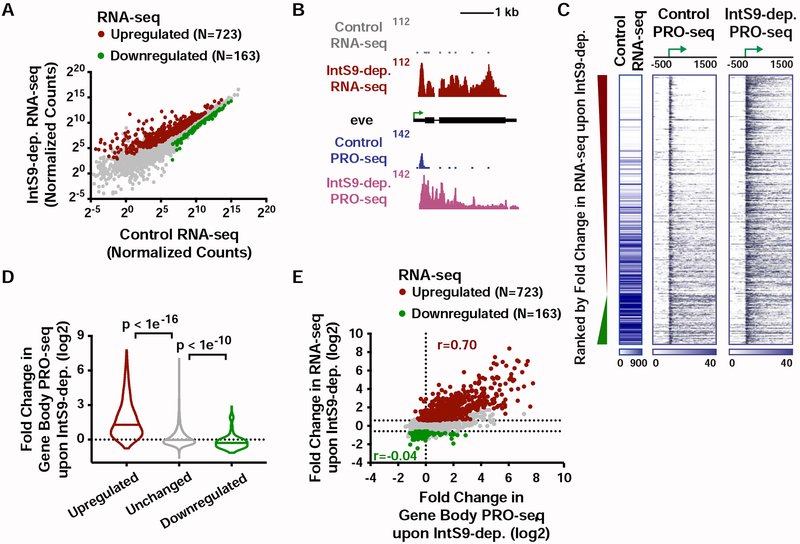
Figure 2. The Integrator complex attenuates expression of protein-coding genes.
(A) Cells were treated for 60 h with control dsRNA, or dsRNA targeting IntS9 (N=3). Normalized RNA-seq signal is shown, with significantly affected genes defined as P<0.0001 and fold change >1.5.
(B) even skipped (eve, CG2328) locus displaying profiles of RNA-seq and PRO-seq in control and IntS9-depleted cells.
(C) Heatmap representations of RNA-seq levels are shown, along with PRO-seq reads from control and IntS9-depleted cells (treated as in A). The location of mRNA TSSs is indicated by an arrow. Genes that are upregulated or downregulated upon IntS9-depletion in RNA-seq are shown, ranked from most upregulated to most downregulated.
(D) Violin plots depict the change in gene body PRO-seq signal upon IntS9-depletion for each group of genes. IntS9-affected genes are defined as in A, as compared to 8613 unchanged genes. Plots show the range of values, with a line indicating median. P-values are calculated using a Mann-Whitney test.
(E) Comparison of fold changes in RNA-seq and PRO-seq signals upon IntS9-depletion. Pearson correlations are shown separately for upregulated and downregulated genes, indicating good agreement between steady-state RNA-seq and nascent PRO-seq signals for upregulated genes, but little correspondence for downregulated genes.
See also Figure S2.

