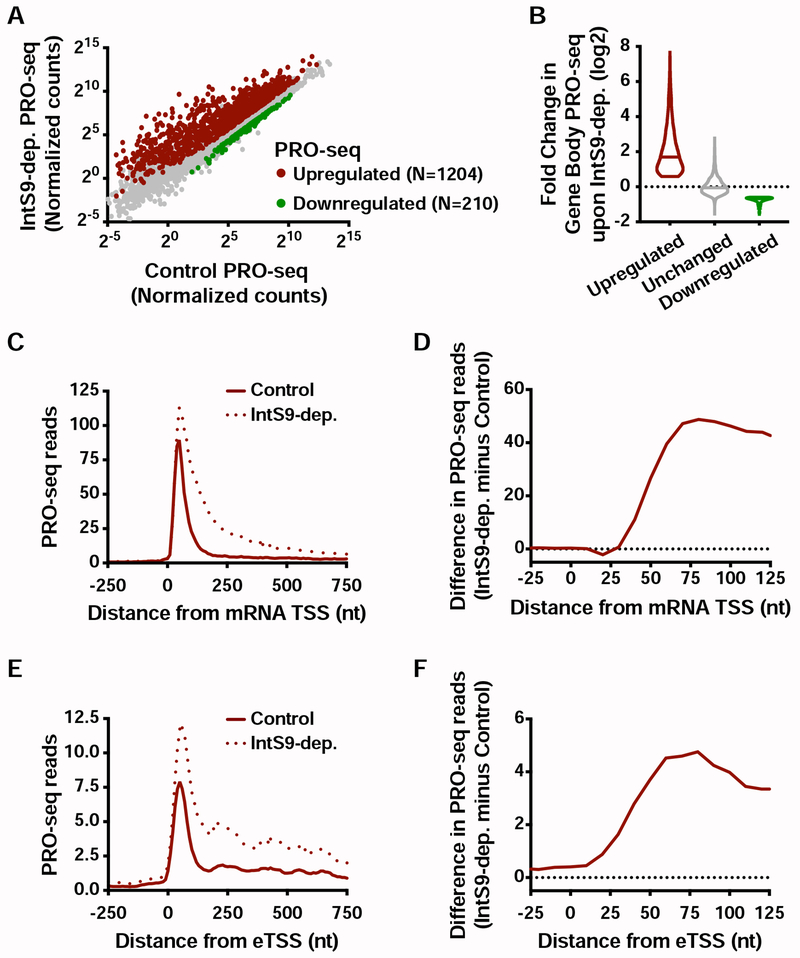
Figure 4. Integrator represses productive elongation at genes and enhancers.
(A) Drosophila cells were treated for 60 h with control or IntS9 RNAi (N=3). Normalized PRO-seq signal across gene bodies is shown, with IntS9-affected genes defined as P<0.0001 and fold change >1.5.
(B) Violin plots depict the change in gene body PRO-seq signal upon IntS9-depletion for each group of genes. IntS9-affected genes are defined as in A, as compared to unchanged genes (N=8085). Violin plots show range of values, with a line indicating median.
(C) Average distribution of PRO-seq signal in control and IntS9-depleted cells is shown at upregulated genes.
(D) The difference in PRO-seq signal between IntS9-depleted and control cells for upregulated genes is shown. Increased signal in IntS9-depleted cells is consistent with the position of Pol II pausing, from +25 to +60 nt downstream of the TSS.
(E) Average distribution of PRO-seq reads from control and IntS9-depleted cells are displayed, centered on enhancer transcription start sites (eTSS) that are upregulated upon IntS9 RNAi (N=228).
(F) Difference in PRO-seq signal between IntS9-depleted and control cells for IntS9-upregulated enhancer RNAs. Note that signal increases at enhancers in the same interval (+25-60 nt from TSS) as at coding loci.
See also Figure S4.

