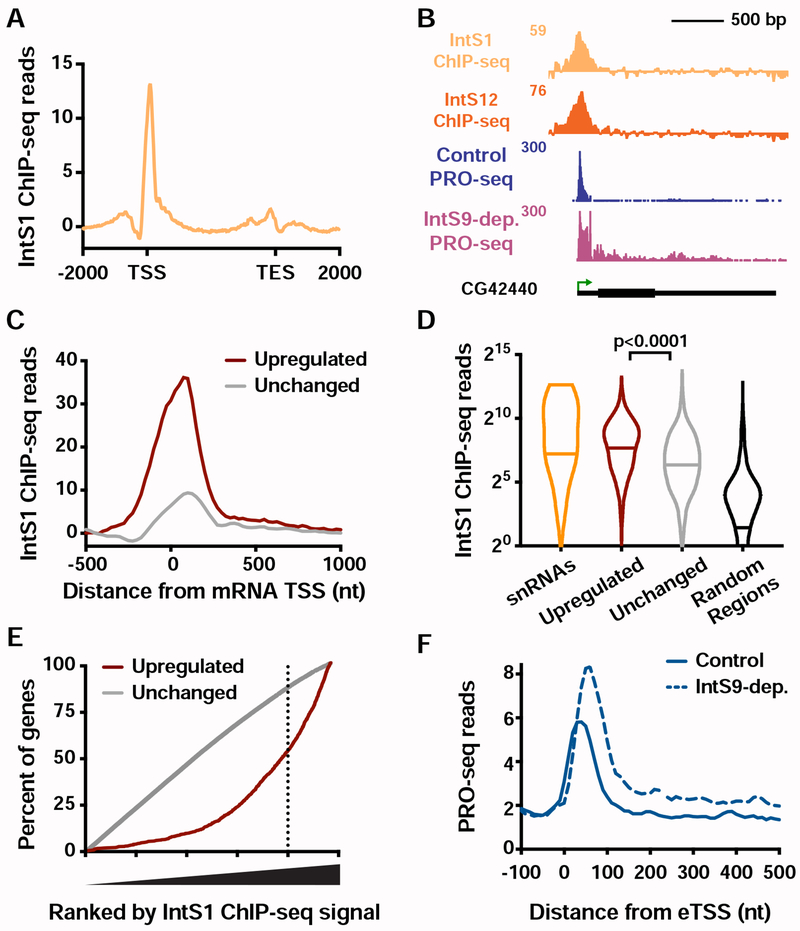
Figure 5. Integrator binding is enriched at target genes and enhancers.
(A) Distribution of IntS1 ChIP-seq signal along the transcription units of all active mRNA genes (N=9499). Windows are from 2 kb upstream of the TSS to 2 kb downstream of the transcription end site (TES). Bin size within genes is scaled according to gene length.
(B) Example locus (CG42440) of an upregulated gene upon IntS9-dep. showing PRO-seq and Integrator ChIP-seq.
(C) Metagene analysis of average IntS1 ChIP-seq signal around promoters of upregulated (N=1204) and unchanged (N=8085) mRNA genes in IntS9-depleted cells. Data are shown in 25-nt bins.
(D) Promoter-proximal IntS1 ChIP-seq reads for each group of sites: snRNAs (N=31), upregulated or unchanged genes, and randomly-selected intergenic regions (N=5000). Violin plots show range of values, with a line indicating median. P-values are calculated using a Mann-Whitney test.
(E) All active genes (N=9499) were rank ordered by increasing IntS1 ChIP-seq signal around promoters (± 250bp), and the cumulative distribution of upregulated or unchanged genes across the range of IntS1 signal is shown. IntS1 levels at unchanged genes show no deviation from the null model, but upregulated genes display a significant bias towards elevated IntS1 ChIP-seq signal.
(F) Average distribution of PRO-seq signal at eTSSs bound by Integrator (N=691) in control and IntS9-depleted cells is shown.
See also Figure S5.

