Fig. 3.

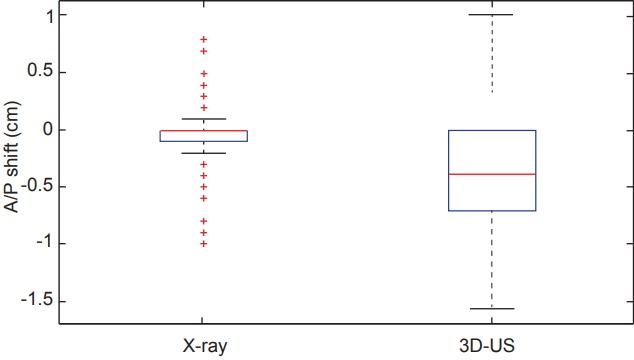
Box plots comparing the distributions of shifts measured in the anterior/posterior (A/P) dimension from both X-ray and ultrasound imaging across the 12 studied patients. 3D-US, three-dimensional ultrasound.

Box plots comparing the distributions of shifts measured in the anterior/posterior (A/P) dimension from both X-ray and ultrasound imaging across the 12 studied patients. 3D-US, three-dimensional ultrasound.