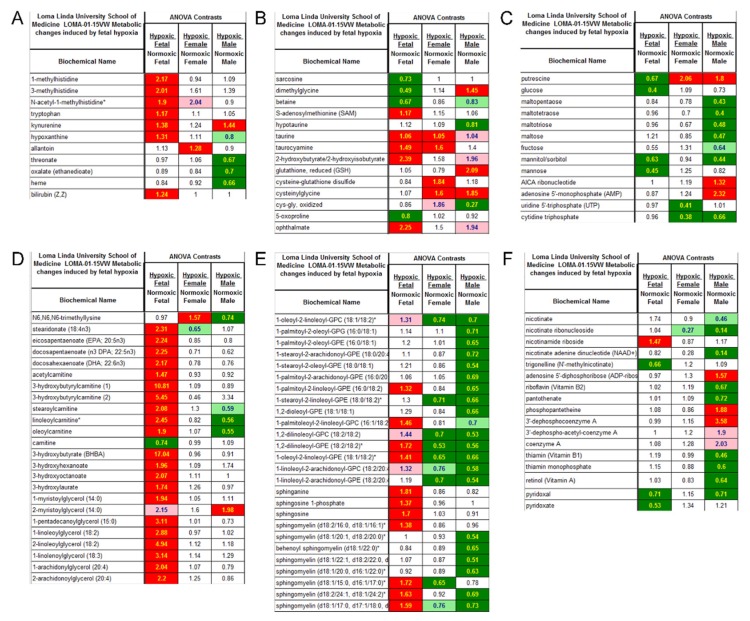
Figure 5.
Pathway heat map of metabolomics data. (A) Inflammation and oxidative stress; (B) sulfur amino acids, methylation, and oxidative stress; (C) glycogen metabolism; (D) fatty acid oxidation; (E) membrane complex lipids; (F) cofactors. Green: indicates significant difference (p < 0.05) between the groups shown, metabolite ratio of <1.00; Light green: narrowly missed statistical cutoff for significance 0.05 < p < 0.10, metabolite ratio of <1.00; Red: indicates significant difference (p < 0.05) between the groups shown; metabolite ratio of ≥1.00; Light red: narrowly missed statistical cutoff for significance 0.05 < p < 0.10, metabolite ratio of ≥1.00; Non-colored text and cell: mean values are not significantly different for that comparison.

