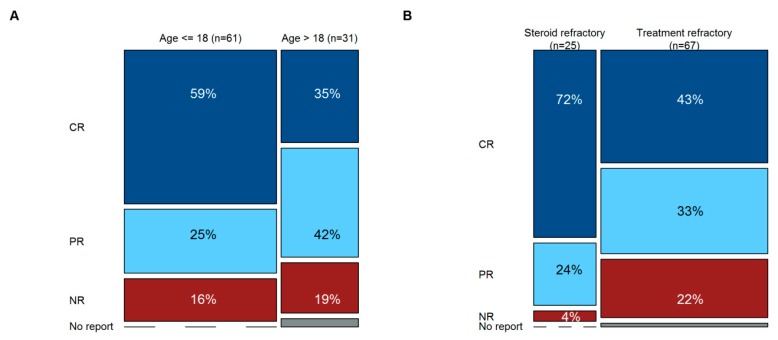
Figure 3.
Response (LFU) by age and degree of refractoriness. The Y-axis shows the quality of response (top to bottom: Prussian blue, CR; baby blue, PR; maroon, NR; grey, no report); the height of each box represents the frequency for this cohort. The X-axis shows children/adolescents vs. adults (A) or only SR-aGvHD vs. TR-aGvHD (B). The width of the columns represents the distribution between these groups. (A) Response rates in pediatric vs. adult patients were similar, although CR seemed to be more frequently observed in the pediatric group. (B) Almost all SR-aGvHD patients responded to MSC-FFM, whereas 22% of TR-aGvHD patients were non-responders. None of the potential differences between groups were statistically significant.

