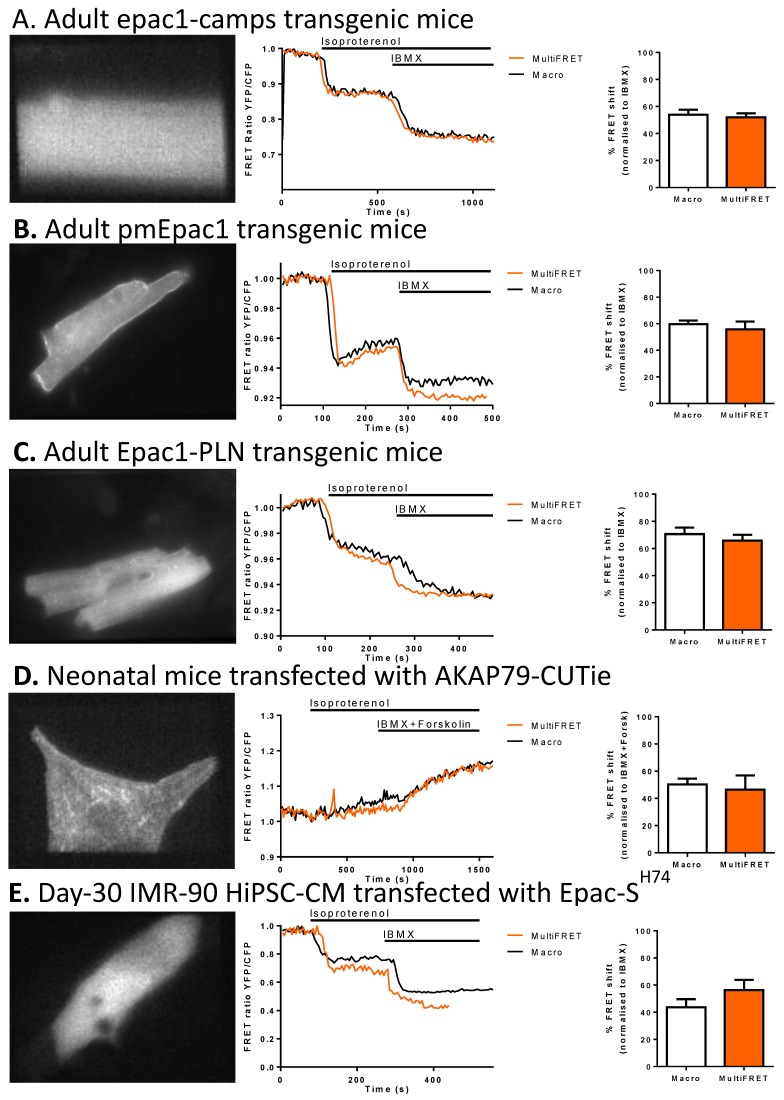
Figure 2.
Software validation experiments showing the yellow channel with a representative cell (left panel), experimental trace and comparison of mean isoproterenol response between MultiFret and the old Macro. The means are normalised to the final plateau of IBMX or IBMX + Forskolin. (A) Adult mice transgenic for Epac1-camps, which causes a decrease in FRET efficiency upon binding cAMP (NS, n = 10). (B) Adult mice transgenic for pmEpac1, which causes a decrease in FRET efficiency upon binding cAMP. (NS; n = 10 for the Macro and n = 9 for MultiFRET). (C) Adult mice transgenic for Epac1-PLN, which causes a decrease in FRET efficiency upon binding cAMP (NS; n = 7). (D) Neonatal mouse CM transfected with the AKAP79-targeted CUTie sensor. This sensor brings fluorophores closer to each other upon binding of cAMP, showing an increase in the YFP/CFP ratio. In this experiment, IBMX (100 µM) and Forskolin (50 µM) were added together and data was normalised against the resulting plateau (NS; n = 6). (E) Day-30 IMR-90 hiPSC-CM transfected with Epac-SH74, which shows a decrease in FRET upon binding cAMP (NS; n = 20 for the Macro, and n = 19 for MultiFRET). For (A–D), data were acquired with the MultiFRET plugin and re-analysed with the ‘offline’ macro according to [13]. E macro data were obtained using the “online” macro and analysed using the “offline” macro according to [13], whereas MultiFRET data were acquired and analysed using MultiFRET with a different set of samples from the macro data. Data are shown as mean % FRET shift ± SEM. Welch’s test for unequal variances was used for statistics. Scale bars are 10 µm.

