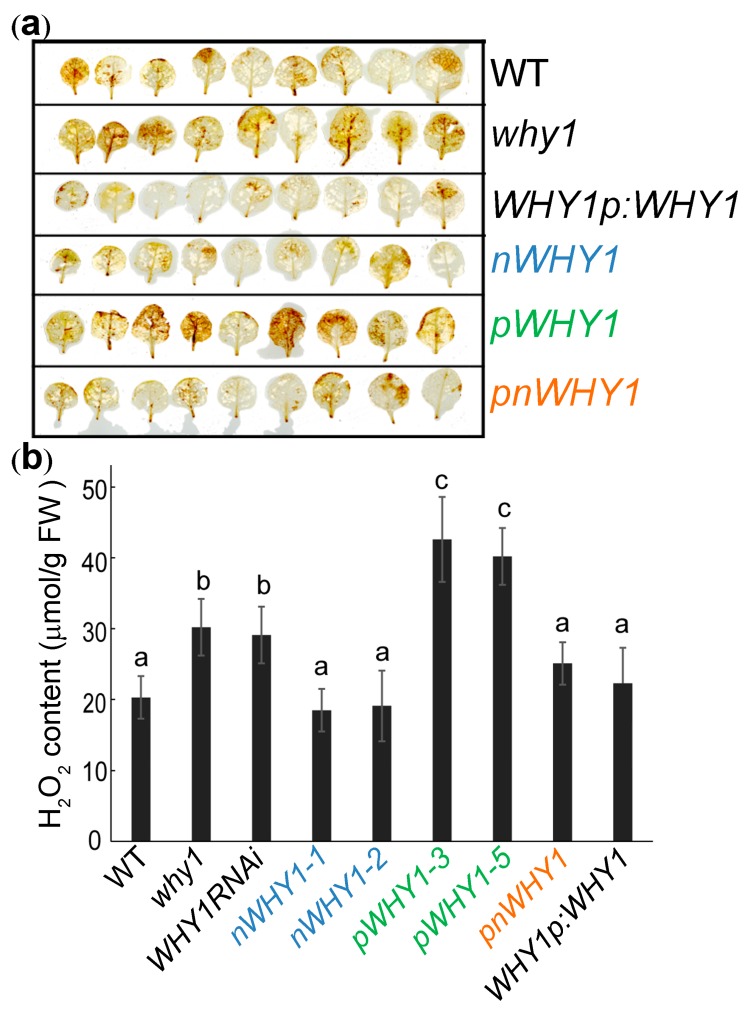
Figure 3.
H2O2 content in leaves of WT, why1, and transgenic plants at day 37 post-germination. (a) Representative DAB staining of rosette leaves for visualization of H2O2 accumulation; (b) H2O2 content in rosettes of the plants. Values are shown as mean ± SD (n = 3). Bars labeled with the same letter were not significantly different based on one-way ANOVA using the Prism software, p < 0.05.

