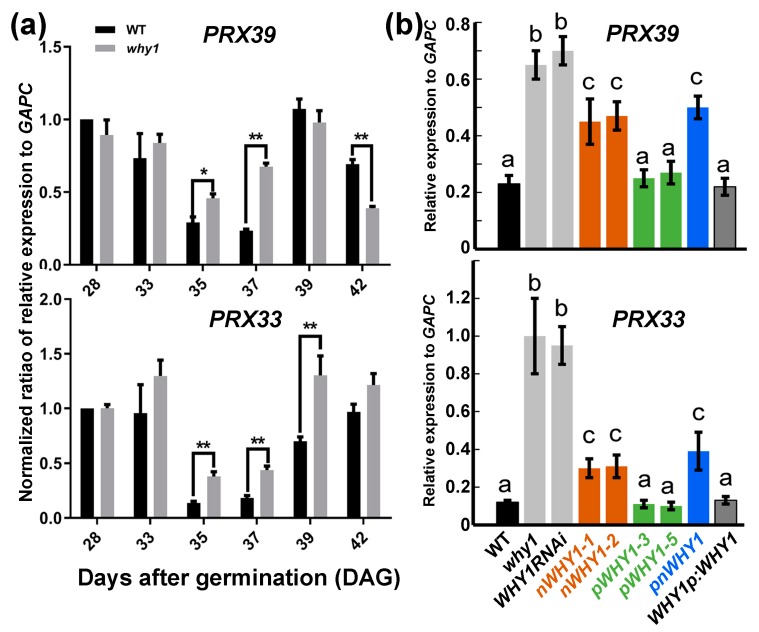
Figure 4.
Quantitative RT-PCR analysis of PRX39 and PRX33 expression. (a) Gene expression during development in WT and why1 plants. Relative expression was normalized to that of WT at 28 days after germination; significant difference between WT and why1 plants was determined by pairwise t-test. * p < 0.05, ** p < 0.01; (b) Gene expression in different lines with ectopic overexpression of WHY1 at 37 days after germination. Error bars represent SD for three biological replicates. Bars with the same letter were not significant in the one-way ANOVA test (p < 0.05).

